Stacked Column — Anearmala
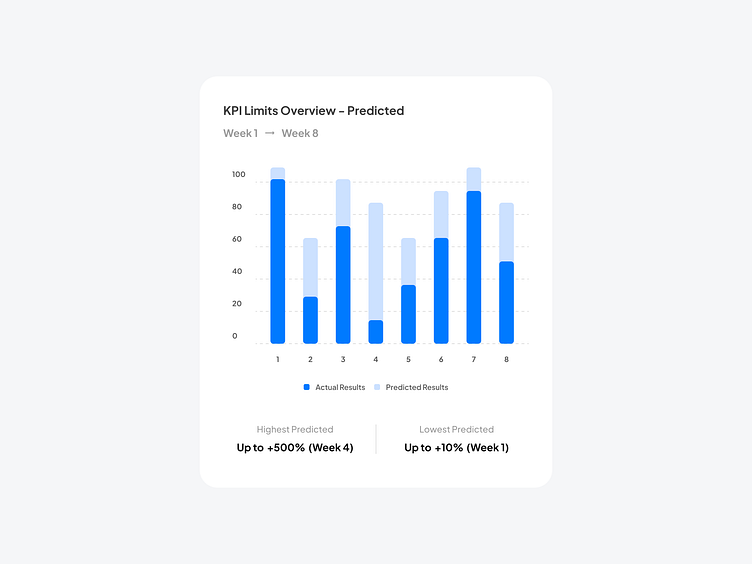
Stacked Column Chart comprises several column series stacked vertically, one on another. The length of each series is determined by the value in each data point. Stacked Column Charts are a great option if you need to simultaneously observe how each of several variables and their sum change. You should pick the Stacked Column Chart type only when the number of series is more than two. With just one series, it would be a usual Column Chart. Nonetheless, it should be noted that including too many series in a Stacked Column Chart may hinder readability.
Stacked Column
↳ Design by Anearmala 🎉
New post every weekday on X (Twitter) + free assets coming soon.
Have a figmadays!
