Donut/Ring — Anearmala
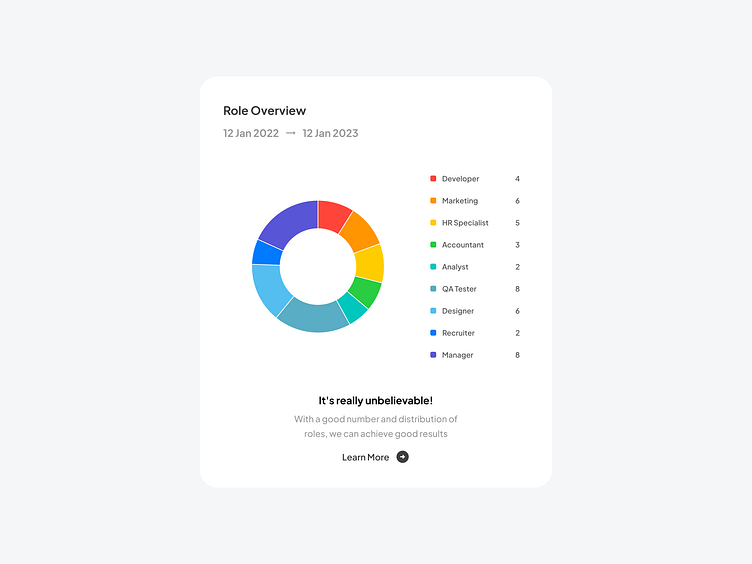
Donut Chart or Donut Graph (also Doughnut Chart or Doughnut Graph) is a variant of the Pie Chart type, with a blank center that allows for additional information about the data as a whole to be included. In Donut Charts, each point is visualized as an arc. The length of each arc is to the circumference as the corresponding data value is to the total sum of all values. For a more beautiful data visualization, Circular Gauges are often used instead of Donut Charts.
Donut/Ring
↳ Design by Anearmala 🎉
New post every weekday on X (Twitter) + free assets coming soon.
Have a figmadays!
