Grouped Column — Anearmala
Column Chart or Column Graph is a chart type that uses vertical bars to display comparisons among categories.Each data point in a Column Chart is represented by a rectangle drawn between the zero line and the corresponding value from the data set. Horizontaly oriented Column Charts are called Bar Charts.
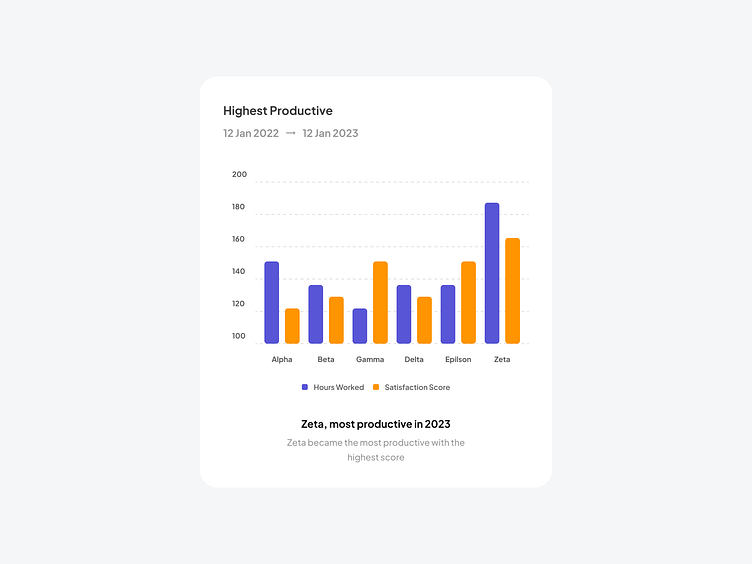
Single-series Column Charts help to compare data point values between themselves. In case of multiple series, points are grouped by category; such a multi-series Column Chart makes it possible to analyze the differences between values inside the categories.
Grouped Column
↳ Design by Anearmala 🎉
New post every weekday on X (Twitter) + free assets coming soon.
Have a figmadays!
