Single Color Bar — Anearmala
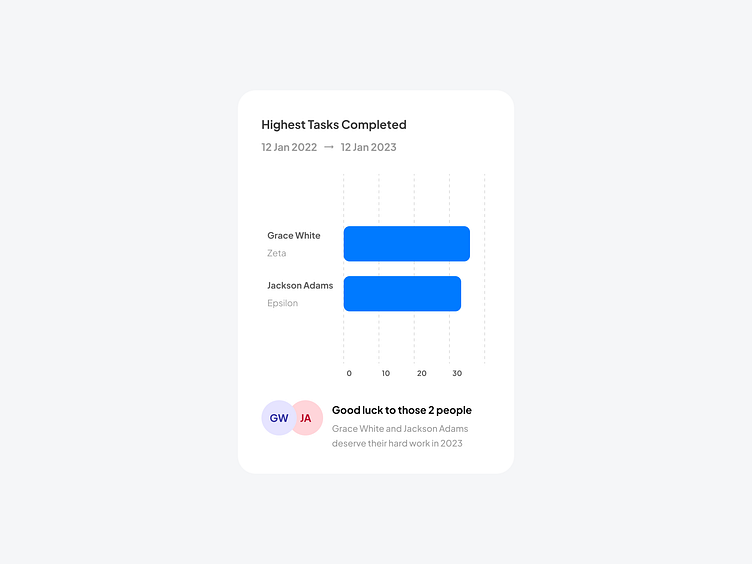
Bar Chart or Bar Graph can only be used to compare values. It displays grouped data using rectangular bars whose lengths are proportional to the values they represent.The bars can be plotted horizontally or vertically. A vertical Bar Chart is sometimes called a Column Chart. Bar Charts are usually scaled so that all the data can fit in the view. Bars on the chart can be arranged in any necessary order.
Single Color Bar
↳ Design by Anearmala 🎉
New post every weekday on X (Twitter) + free assets coming soon.
Have a figmadays!
