Dashboard. Rental Trends Analytics
Hello there, Dribbblers!
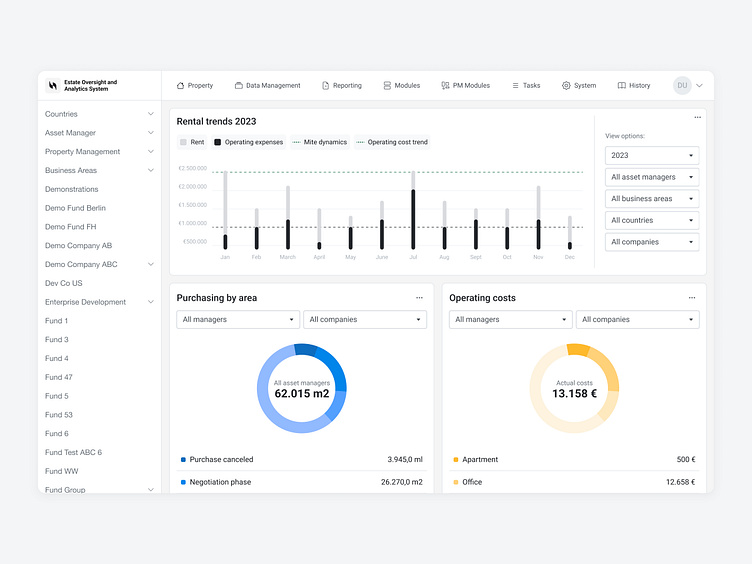
We are here to show a new screen! The screen serves as an informative tool for real estate market analysis. The first widget showcases rental trends using a column chart, where the y-axis reflects property prices and the x-axis corresponds to months. The second widget provides an overview of purchases by areas through a pie chart, while the third widget focuses on operating costs using a similar chart. This intuitively designed data visualization allows for easy analysis and tracking of key trends and the structure of the real estate market.
If you what to start a project, contact us via hello@equal.design