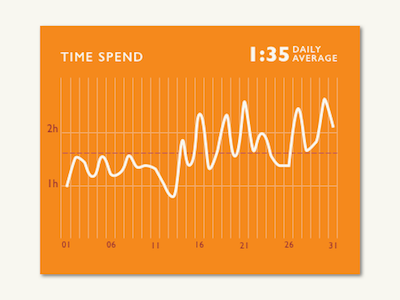
018 Analytics Chart
Daily UI Challenge: Analytics Chart.
This was challenging :) because of being very fiddly to create a chart with accurate data.
The data I used for this challenge was gathered in August when I kept a spreadsheet of all the apps I used every day on my phone and how much time I spend using the phone.
Typeface used today is Gill Sans, because it featured in one of the email newsletters I got from a type foundry yesterday.
The attachment contains the full view with some more graphs.
More by Joke De Winter View profile
Like

