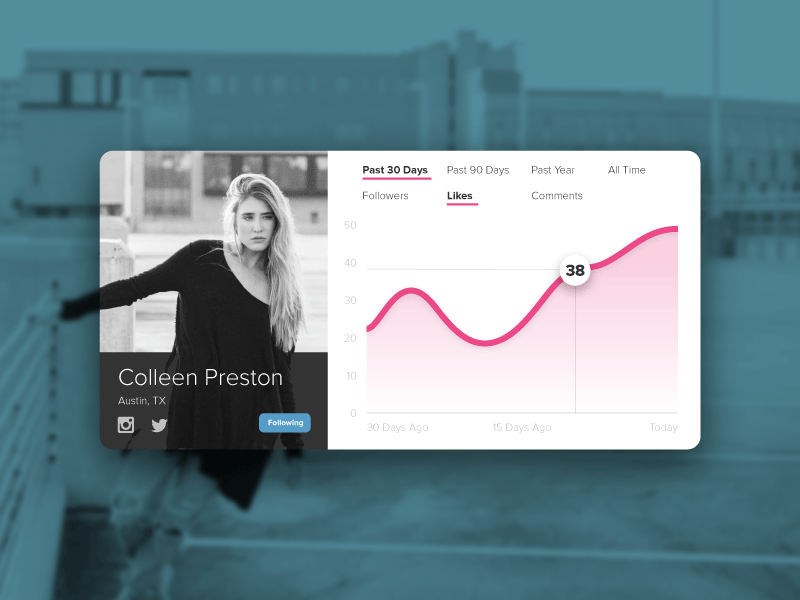
Dribbble Data Graphs
Daily UI #18 - Analytics Graph
Decided to graph out some dribbble stats. User would be able to drag the indicator around on the line and see how many likes/comments/followers they had on that day. Can also toggle between a 30 day, 90 day, yearly, or all-time chart.
More by Aaron Tenbuuren View profile
Like
