Trading App
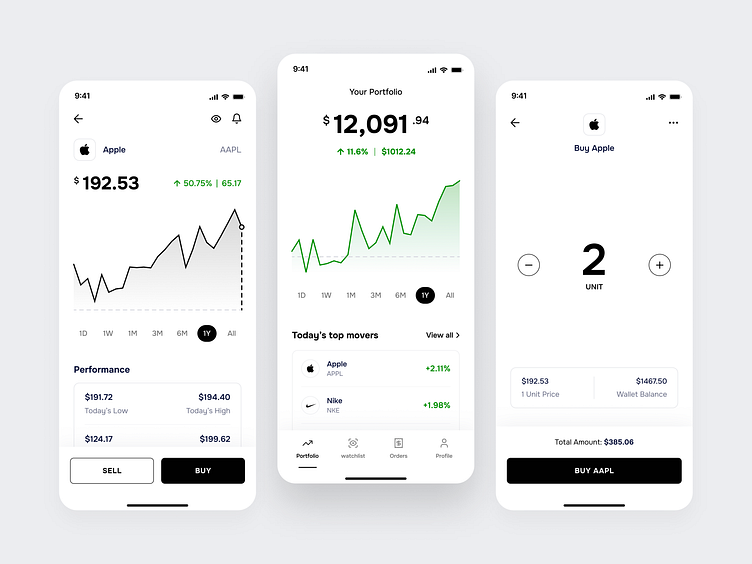
The image shows three smartphone screens that display a mobile application interface for tracking and investing stocks.
The components in the image are:
A stock card that displays the name, symbol, current price, and percentage change of a specific stock. It also has buttons to sell or buy the stock.
A performance graph that plots the stock or portfolio value over time. It has a green color to indicate positive growth and a red color to indicate negative growth. It also shows the who is the top movers from your portfolio.
A unit selector that lets the user choose the number of units they want to buy or sell. It has a slider and a text input to adjust the value.
A total amount that shows the total purchase or sale amount based on the unit price and the number of units.
Liked our work and want to work with us?
Email us at 📩 hi@dvinu.com or 📞schedule a call
---
Follow us on Dribbble • Twitter • LinkedIn
Visit our website 👉🏾[dvinu.com]
