Analytics Dashboard Wireframes
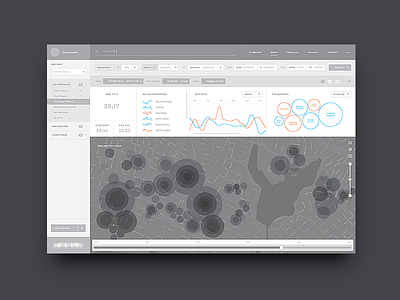

Here is a quick concept of an analytics platform that illustrates data being displayed in a heat map indicating activity volume.
Here is a quick concept of an analytics platform that illustrates data being displayed in a heat map indicating activity volume.