Graphne - Dependencies graph
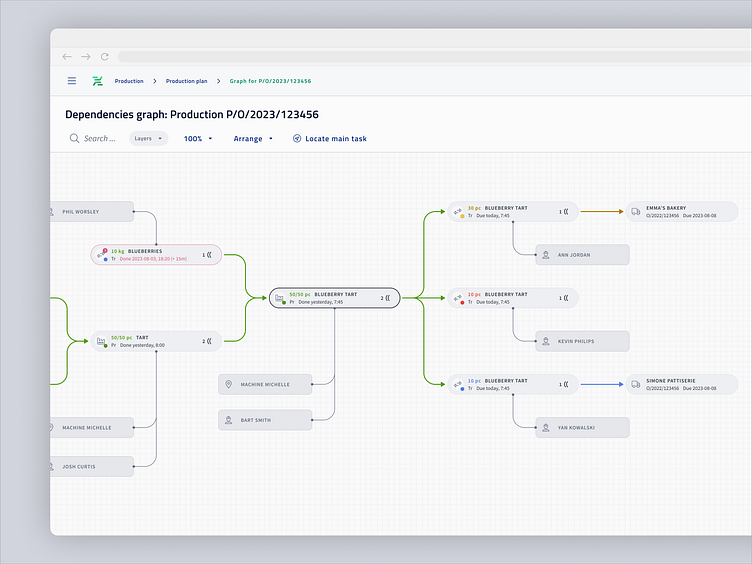
After many tryouts we have decided to not insert dependency graph at the same page as gantt diagram. Mainly because the amount of data processed beneath is enormous. Secondly - it simplified navigation system a lot.
User using this view is entirely focused on operating on dependency diagram - can filter the view, see the status of dependent tasks and what is blocking particular task. Also, entire tree structure visible on to-do list is set here, as well as the order that created these tasks.
Whereas the gantt diagram shows queues of production - what is to do after what, the dependency graph focuses on one task and its relations - other tasks, assets, orders.
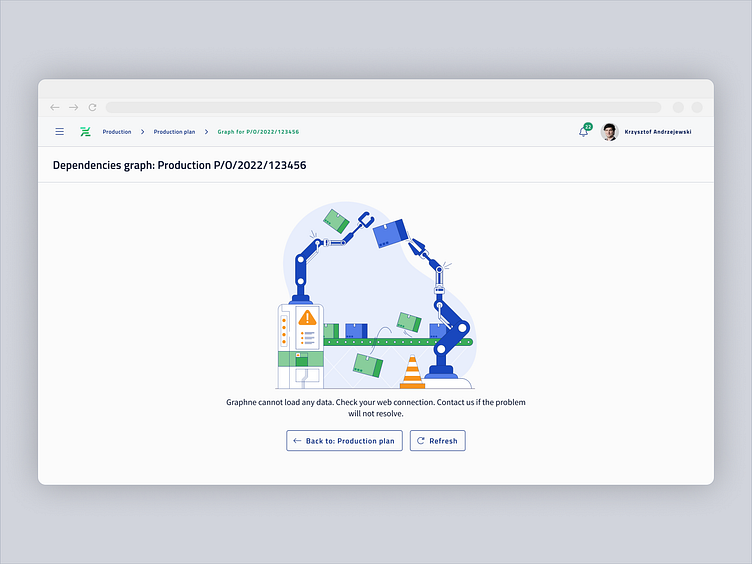
While designing design guidelines for new UI of Nexelem and Graphne, our VirtusLab graphic illustrator provided vector illustrations for empty states.
---
At VirtusLab Digital, we specialize in transforming user experiences through comprehensive UX research, intuitive UI/UX design, and reliable design systems supported by Front-end and Back-end development.
Need assistance? We’re here to help:
Discover more about VirtusLab and dive into our case studies at: