Daily UI - 018 Analytics Chart
#DailyUI Challenge
018 - Analytics Chart
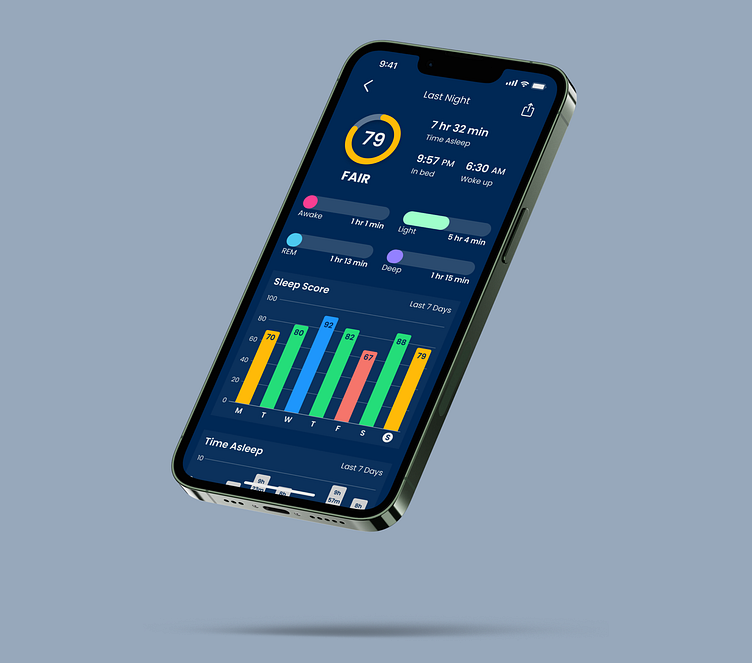
I created a screen for a sleep tracking app that shows a user's sleep score, hours slept, and the number of hours in each cycle. It also shows graphs of different statistics over the last week, so the user can compare results from day-to-day.
