Analytics Dashboard UI
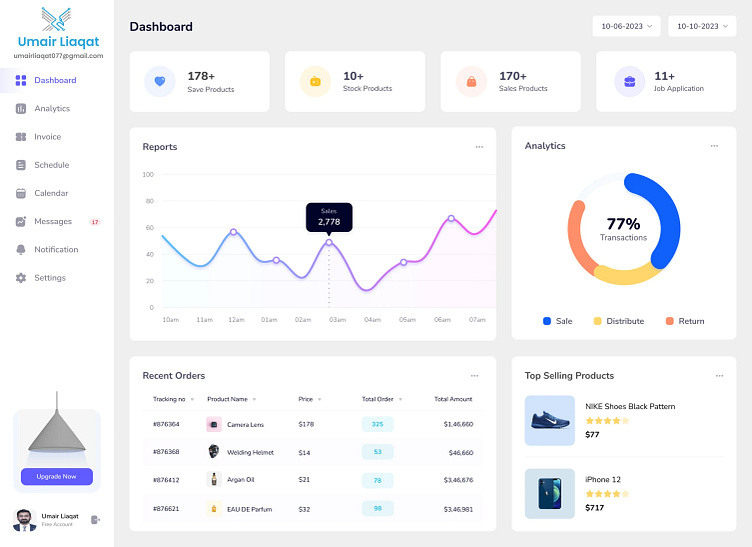
📊 Dive into the essence of modern web design with our latest creation – a sleek and intuitive analytics dashboard that turns data into visual stories. Key features include:
Vivid Data Visualization: Engage with an eye-catching color palette that highlights key metrics, making data analysis a breeze. 🎨
Real-Time Sales Reports: Stay updated with live sales curves and percentages that encapsulate your business performance at a glance. 📈
Effortless Order Tracking: A clear, concise list to keep track of recent orders, complete with product names, prices, and total transactions. 🛒
Best Sellers on Display: Instantly identify your top-performing products, showcased with images, ratings, and prices. 🌟
User-Friendly Layout: Navigation made simple with a clean sidebar menu, ensuring a seamless user experience. 🧭
Love this design and want it for yourself?
Contact us now to get started!
🌟 Email 🌟
🌟 Whatsapp 🌟
+92 332 7037757 | Quick Message via Whatsapp
🌟 Linkedin 🌟
https://www.linkedin.com/in/umairliaquat/
#WebDesign #UIDesign #DashboardUI #DataVisualization #UserExperience #UXDesign #WebDev #EcommerceDashboard #AnalyticsInterface #DesignInspiration #DribbbleCommunity
