UI Dashboard Overview

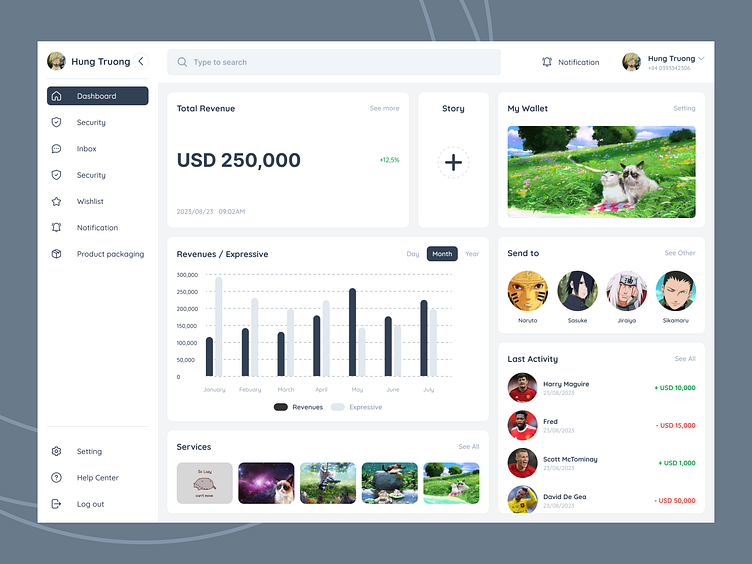
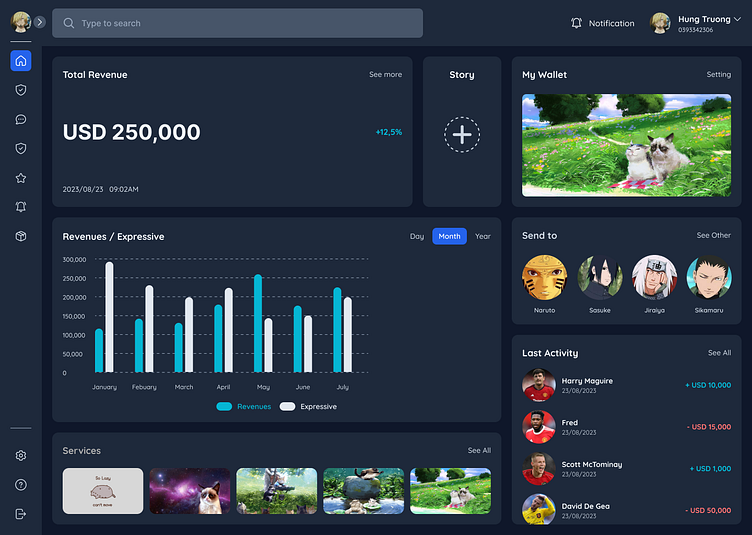
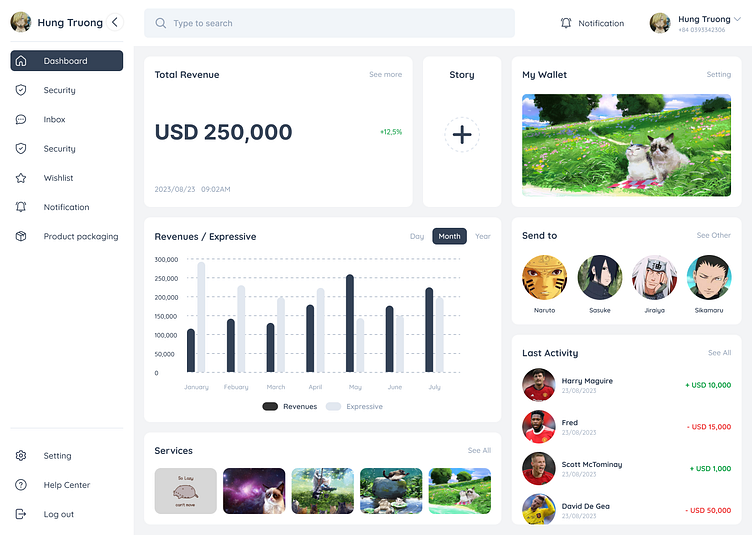
Dashboard is an essential tool in the field of data management and monitoring, used to synthesize and display important information or activities of a system or business in a visual and easily trackable manner. Dashboards are typically designed to provide an overview of performance, real-time data, or data related to the goals or Key Performance Indicators (KPIs) of an organization. They can present information in the form of charts, bar graphs, pie charts, and other visual elements to help users make decisions based on data. Dashboards are often customized to suit the specific needs of individual users or organizations, making them a crucial tool for managing, monitoring, and analyzing data.
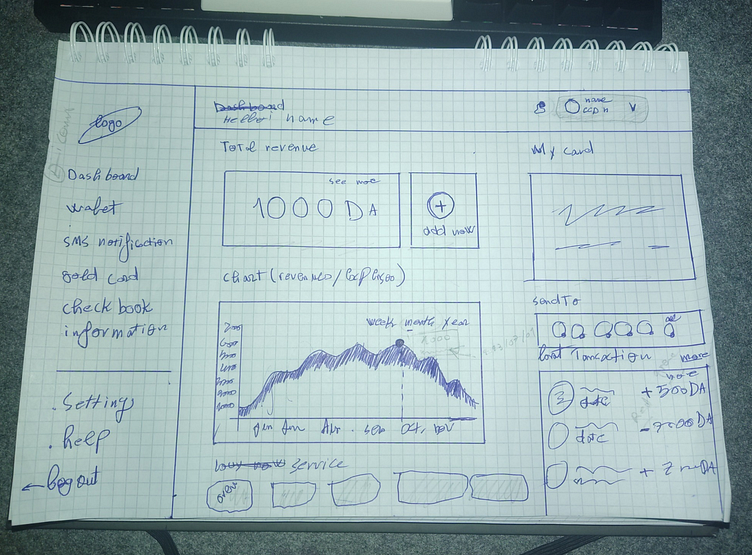
Based on the available sketch template.
Two modes, light and dark, are suitable for user experience.
Thank you for following me on Dribbble! Your support means a lot to me, and I look forward to sharing more of my work with you. If you have any feedback or questions, please don't hesitate to reach out. I appreciate your interest and hope you enjoy what's to come!