Personal Journey Infographic
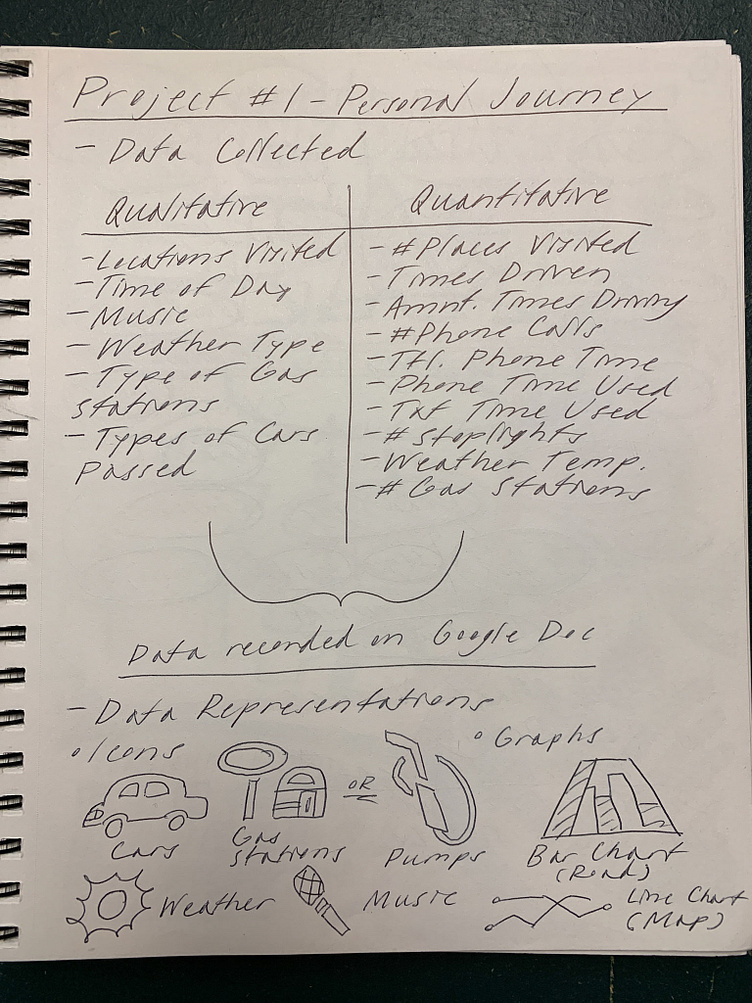
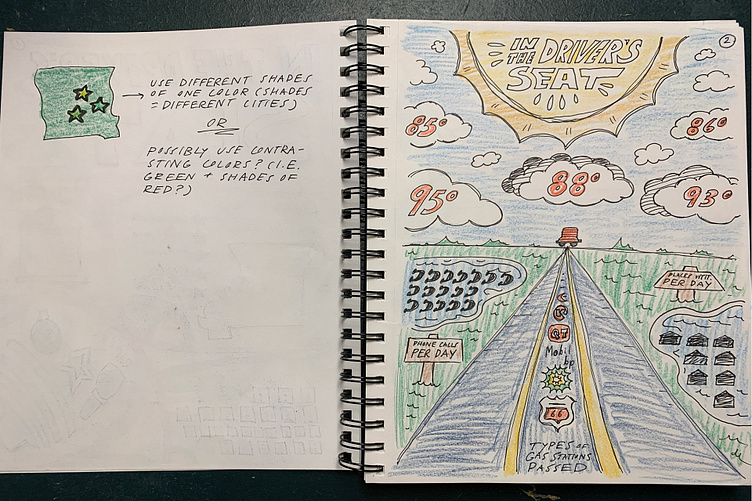
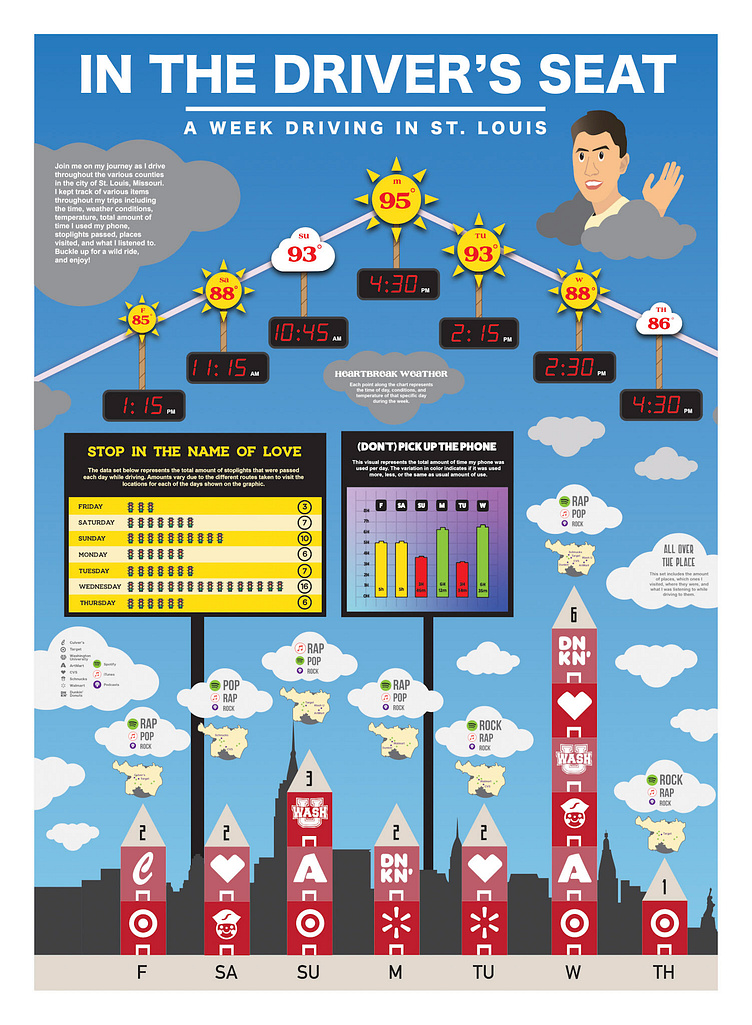
This infographic condenses all of the information and aspects of my journey collected during a week's worth of time traveling throughout the St. Louis metro area, including both categorical data and numerical data. The graphic itself creates an environment surrounding these visuals as well, such that viewers are transported into the same conditions during my travels.
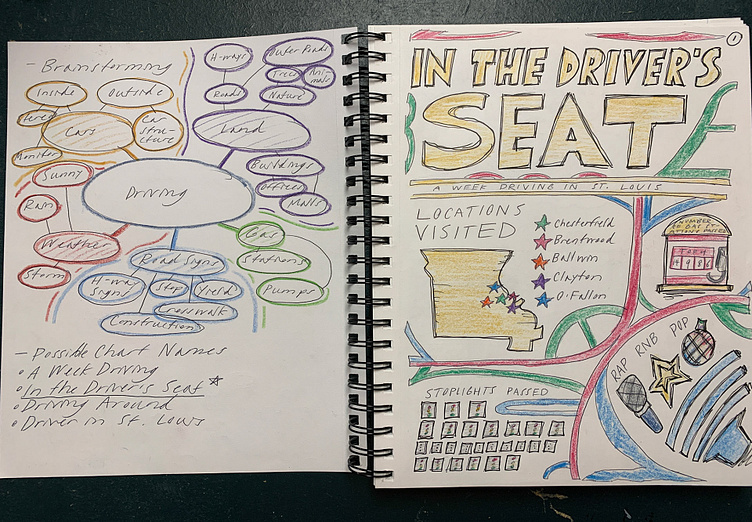
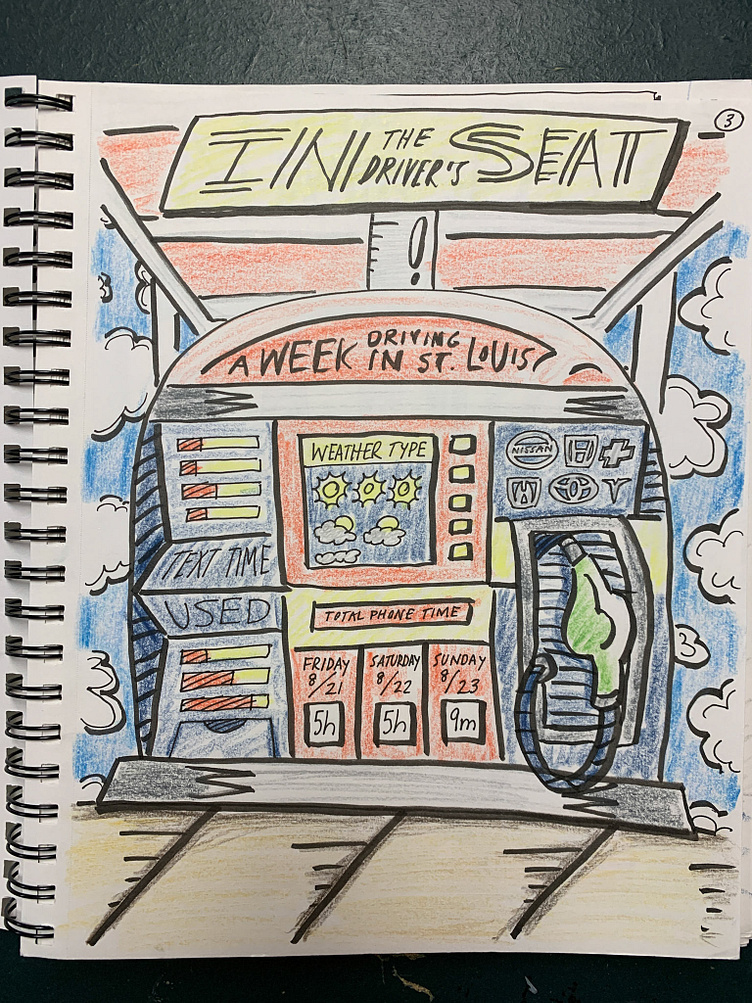
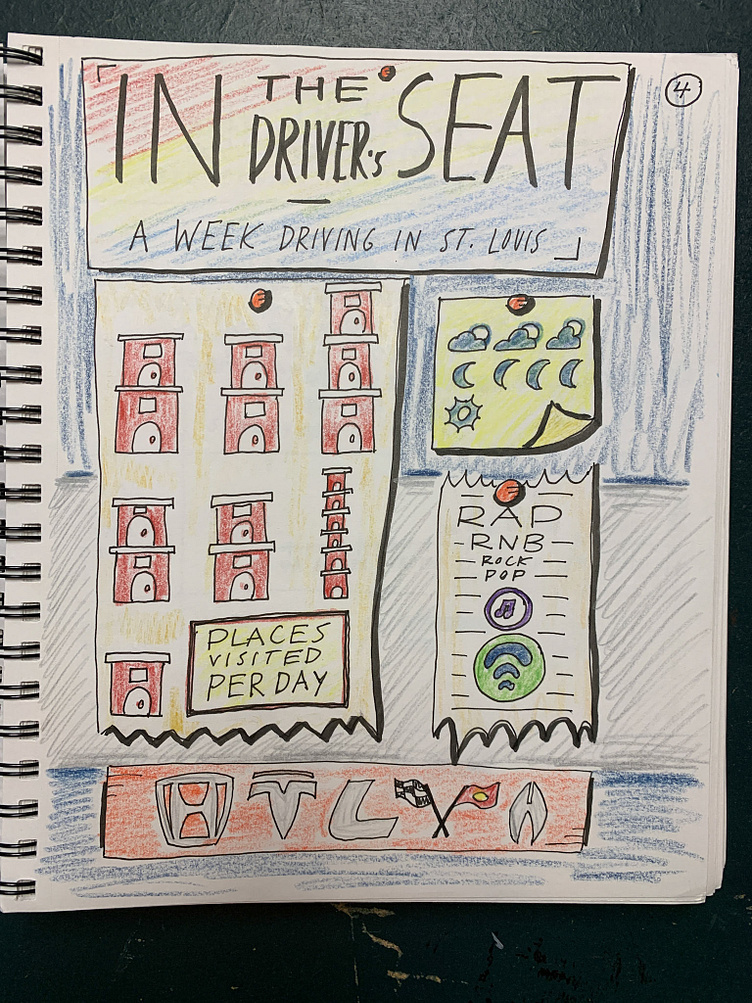
It relied heavily on personal data collection and observing numerical and categorical data. I had several different options for ideas (daily walks, habits, hobbies), but I ultimately found that driving became a main routine of mine during the pandemic period and something to clear my mind. After drives, I would combine data that I observed, from researching the directions online, and by looking at information that my phone recorded. This allowed me to put together a comprehensive list of several types of unique data that I could use in my infographic. As I sketched, I was also trying to think of how to make the infographic in a visually stimulating way that captured the world I was driving in. I sketched multiple layouts, some environmental, some more categorized, and figured out what elements would work best for the final piece.
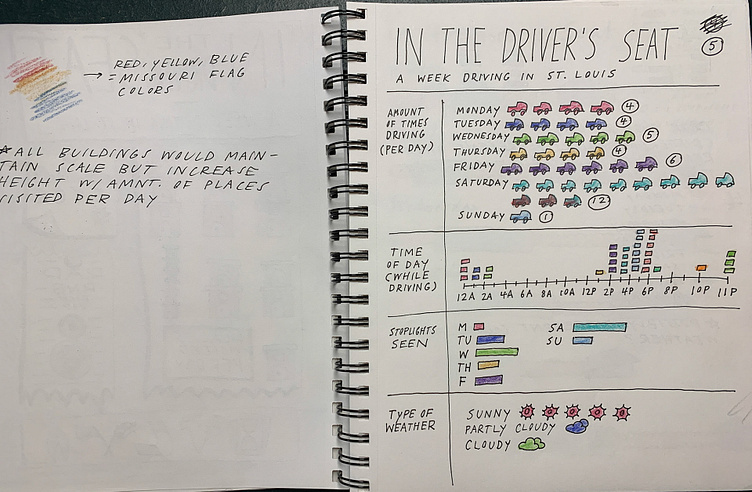
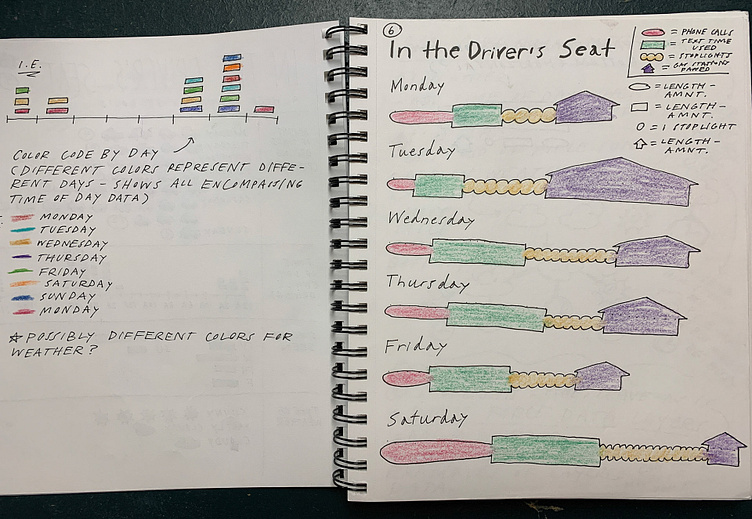
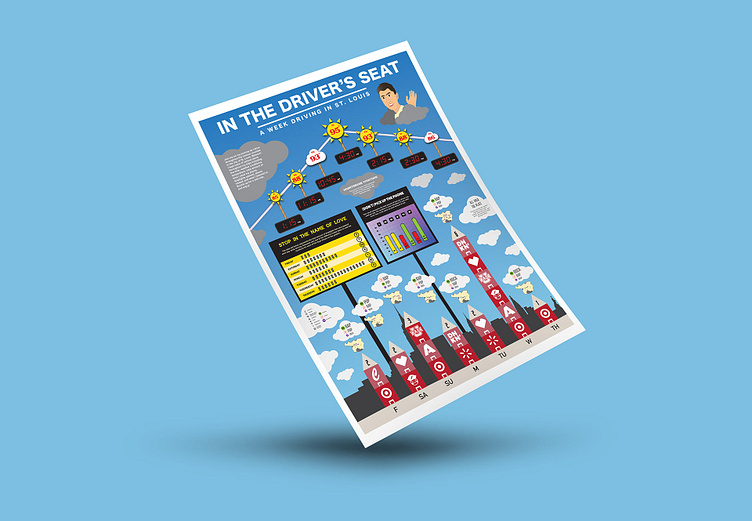
To meet that goal I decided on the final design you see below, which is a combination of a main environmental idea and multiple categorized layout concepts. The city grounds the infographic while the sky and the clouds give it a sense that the space expands beyond what is there. These pieces also gave me beneficial space to put key information and related elements, such as types of music I listened to or weather patterns. In terms of numerical data, I went with temperature each day, time of day I started driving, number of stoplights, how long I used my phone by the drive's end, and the number of places I visited. Categorical data included type of weather (sunny, cloudy), battery percentage (high, medium, low), genre of music most listened to, the music service I listened to most, and the types of places I visited along the way. Choosing these aspects worked out in my favor since they were related to each other and covered both ends of the data I needed.