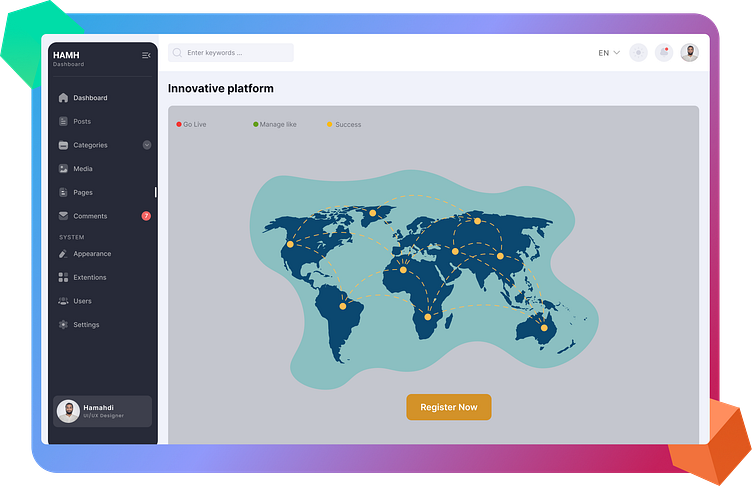
Innovative platform
A dashboard typically refers to a visual display of key information or data, often in a condensed and user-friendly format. Dashboards are commonly used in various fields, including business, technology, and data analytics, to provide a quick overview of essential metrics or information. Here are some common types of dashboards:
1. Business Dashboard: In the business context, a dashboard may display key performance indicators (KPIs), financial data, sales metrics, and other information to help executives and managers make informed decisions.
2. Data Dashboard: Data dashboards are used in data analytics and data visualization to present data in a visually appealing way. They can include charts, graphs, and other visual elements to help users understand complex data.
3. Project Management Dashboard: Project managers often use dashboards to track project progress, monitor tasks, and analyze project performance. These dashboards can show timelines, task completion rates, and resource allocation.
4. IT Dashboard: IT professionals may use dashboards to monitor the health and performance of computer systems, networks, and infrastructure. These dashboards can provide real-time data on system status and issues.
5. Social Media Dashboard: Social media marketers and digital marketers use dashboards to track engagement, follower growth, and campaign performance on platforms like Facebook, Twitter, and Instagram.
6. Customer Relationship Management (CRM) Dashboard: CRM dashboards display customer information, sales leads, and interactions with customers to help sales and customer support teams manage relationships effectively.
7. Financial Dashboard: Financial analysts and professionals use financial dashboards to track financial data, including revenue, expenses, and financial ratios.
8. Healthcare Dashboard: Healthcare providers may use dashboards to monitor patient data, such as vital signs, lab results, and treatment plans.
Dashboards can be customized to show the most relevant information to the user, often in a visual and easily digestible format. They are designed to provide a real-time or near-real-time snapshot of the data, enabling quick decision-making and data-driven insights.
Dashboards can be created using various tools and software, such as Microsoft Excel, Tableau, Power BI, Google Data Studio, and custom-built software solutions. The choice of tool depends on the specific needs and preferences of the user or organization.
