Analytics Chart ( Dashboard )
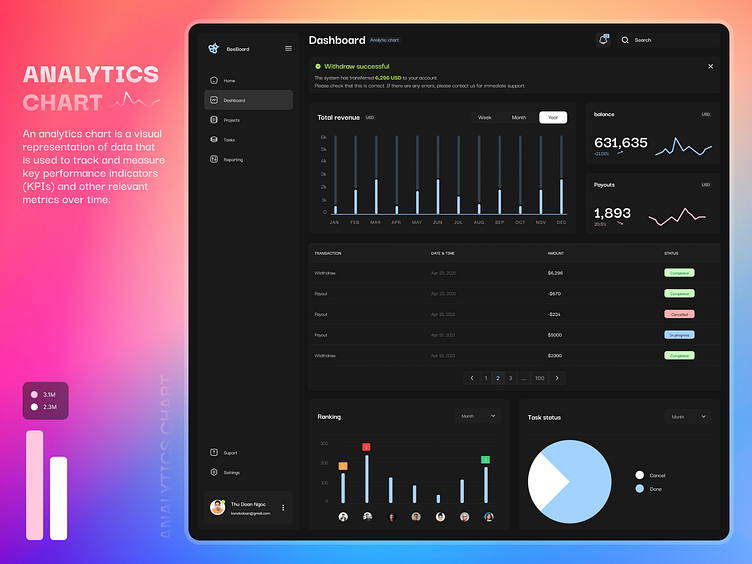
An analytics chart is a visual representation of data that is used to track and measure key performance indicators (KPIs) and other relevant metrics over time.
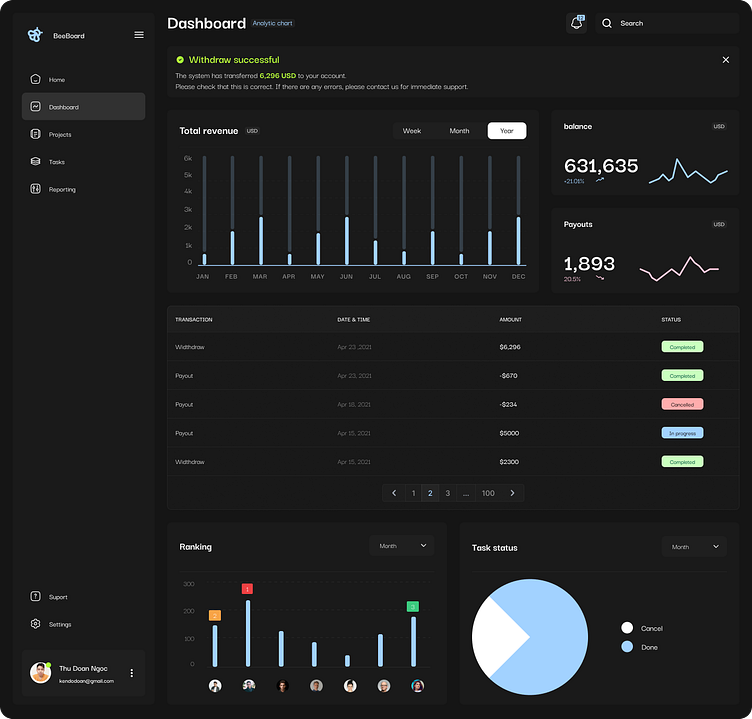
An analytics chart is a visual representation of data that is used to track and measure key performance indicators (KPIs) and other relevant metrics over time.
