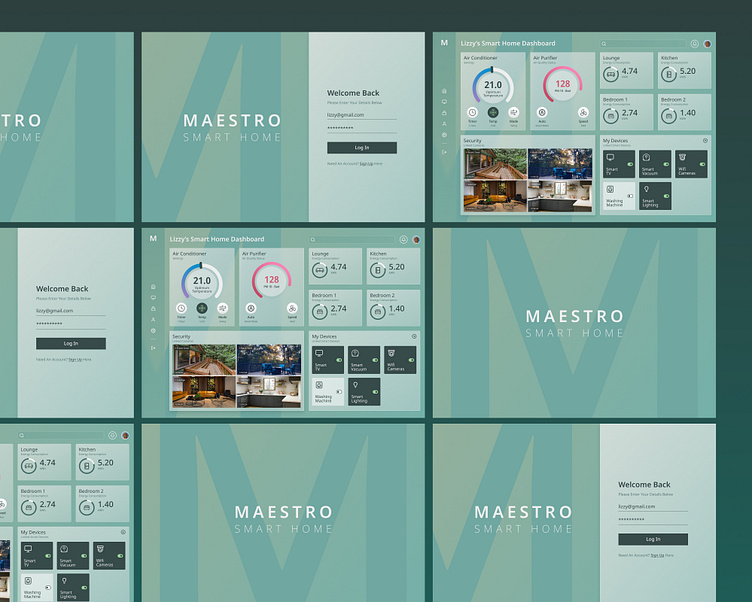
Smart Home Dashboard Concept
Description
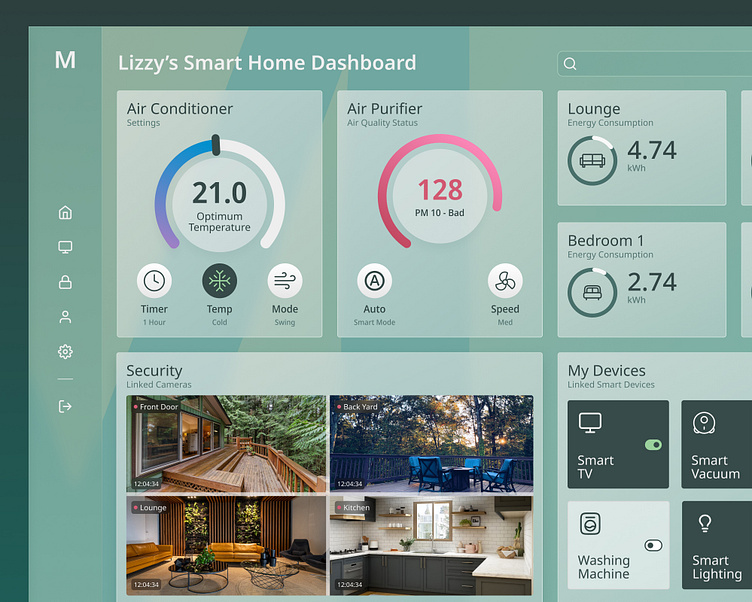
This smart home dashboard provides users with a comprehensive overview of their smart devices, power consumption, and security in an elegant and minimalist way.
The dashboard supports a wide range of smart devices, including smart TVs, smart vacuums, Wi-Fi cameras, washing machines, and smart lighting. It also monitors power consumption for key living spaces, such as the lounge, kitchen, and bedrooms.
Approach
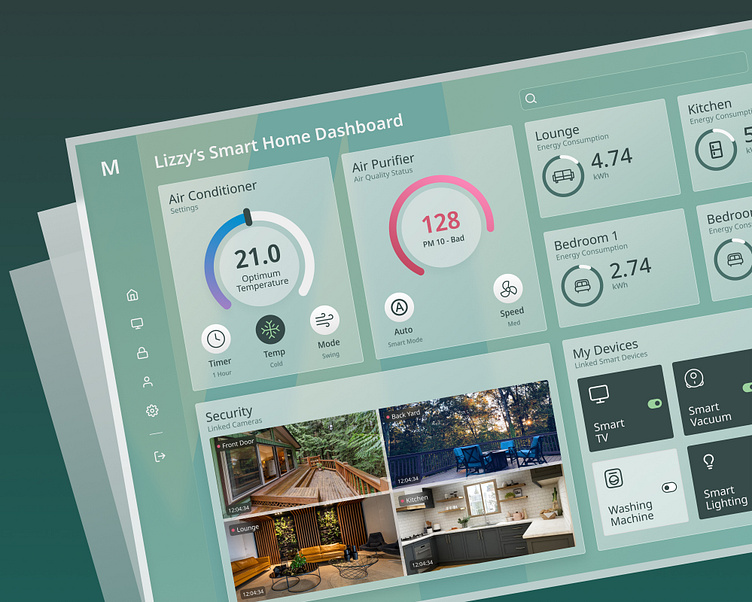
I wanted to create a design that was both visually appealing and functional. I used Glassmorphism to create a sense of depth and transparency, and I used subtle colours and minimalist icon styles to create an uncluttered interface. I also carefully considered the contrast between different elements of the design to ensure that it is both accessible and easy to read.
I've experimented with the following Gestalt principles:
Proximity: The dashboard uses proximity to group related information together, making it easy for users to scan the dashboard and find the information they need quickly.
Similarity: The dashboard uses similarity to encode data, such as using different colors to represent different types of devices or different shades of the same color to represent different levels of power consumption. This makes it easy for users to visually identify patterns in the data.
Continuity: The dashboard uses continuity to lead users' eyes through the dashboard in a logical order, making it easier for them to follow the data and understand the relationships between different pieces of information.
Closure: The dashboard uses closure to allow users to fill in the gaps in the data, making it easier for them to understand the overall picture.
Figure-ground: The dashboard uses figure-ground to create a clear distinction between the foreground and background elements, making it easy for users to focus on the most important information. your text here...