Dashboard for Private Firm

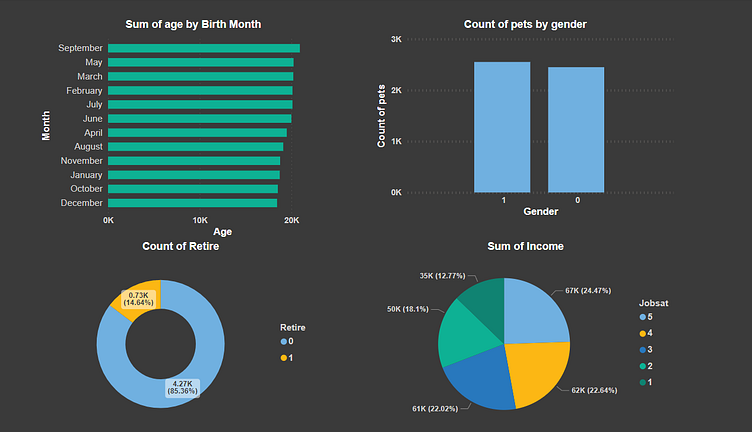
Visualized the distribution of worker ages by their birth month through a Stacked Bar chart, providing a clear understanding of age demographics within the organization.
Utilized a Stacked Column chart to analyze and count the number of pets by gender.
Employed a Donut chart to calculate and visualize the gender-wise distribution of retired employees. Enhanced data analysis by presenting a Pie chart showcasing the summation of worker incomes categorized by job category.