Day 18: Crafting Dynamic Analytics Charts for Data Insights
📊 Day 18 of my 100 Days UI Challenge! Today's challenge: creating a dynamic analytics chart.
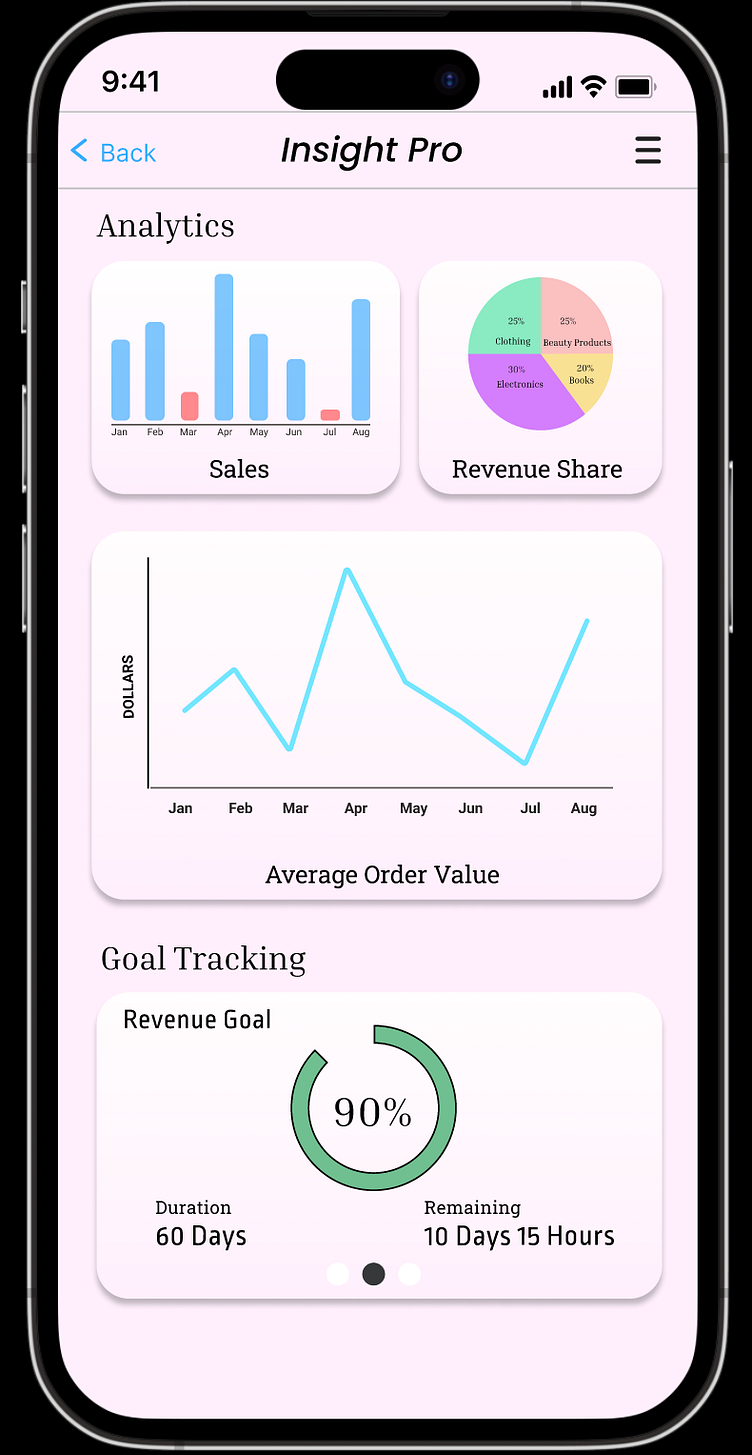
Analytics charts play a crucial role in data visualization and decision-making. Here's a glimpse of my design work in this area!
Your unwavering support and feedback fuel my creativity as I journey through the world of UI design. Thank you for being part of this exciting adventure! 🎨📈
#100DaysUI #AnalyticsChartDesign #Day18
