Village of 100 infographic
CHALLENGE
Data Infographic
Population demographics
To create a data visualisation from the data collected for the suburb of Brimbank demographic survey
SOLUTION
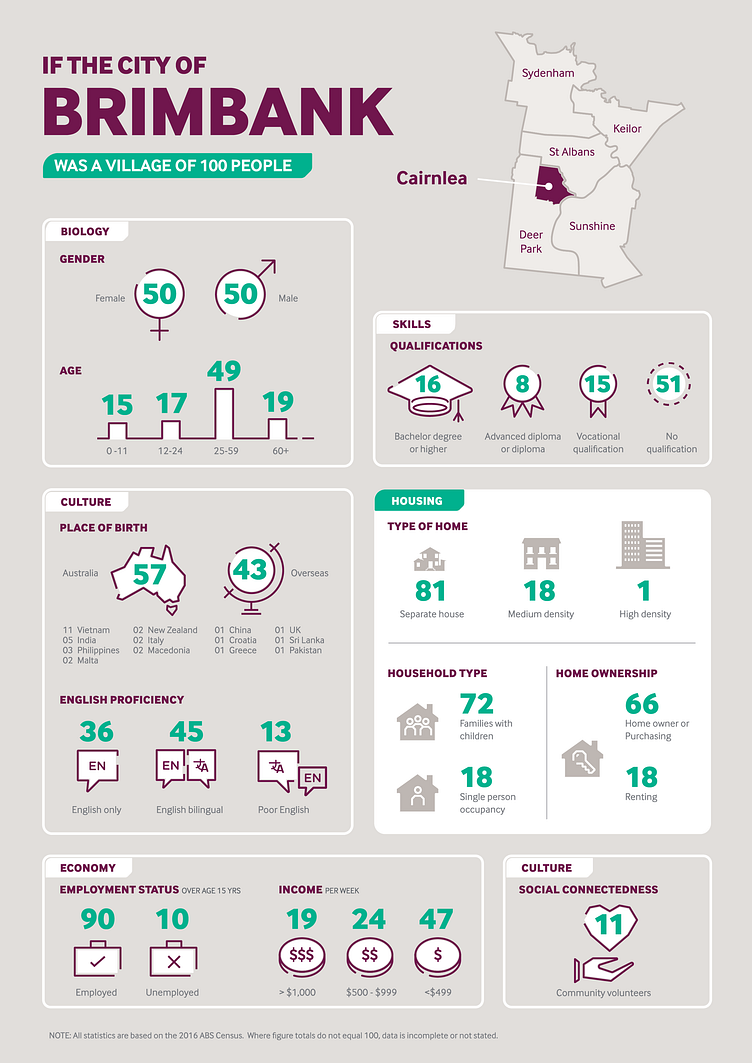
Village of 100
Infographic one-page data visual. Tells the story of Brimbank’s demographics from the ‘Village of 100’ perspective, where each number represents a percentage of the suburb’s population.
ROLE
Art direction / Concept / Design & layout / Illustration / Finished artwork