Daily UI #17 - Line graph chart
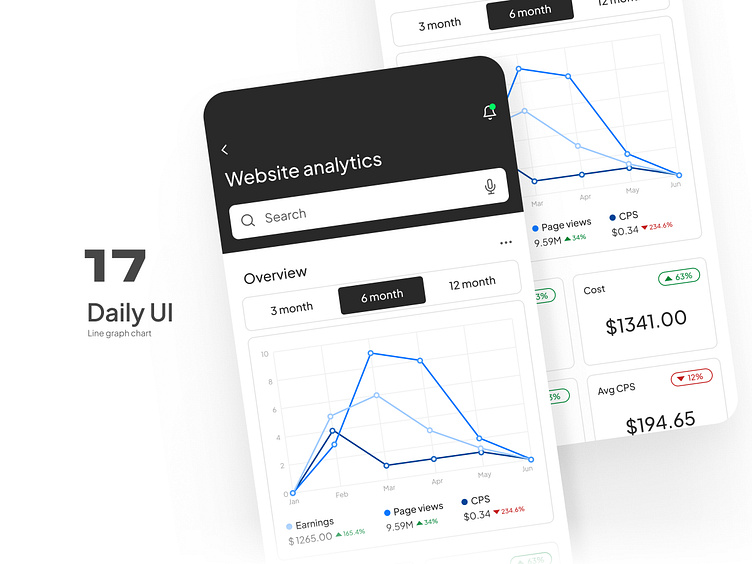
Hi! Today is the 17th day of my #dailyui challenge!
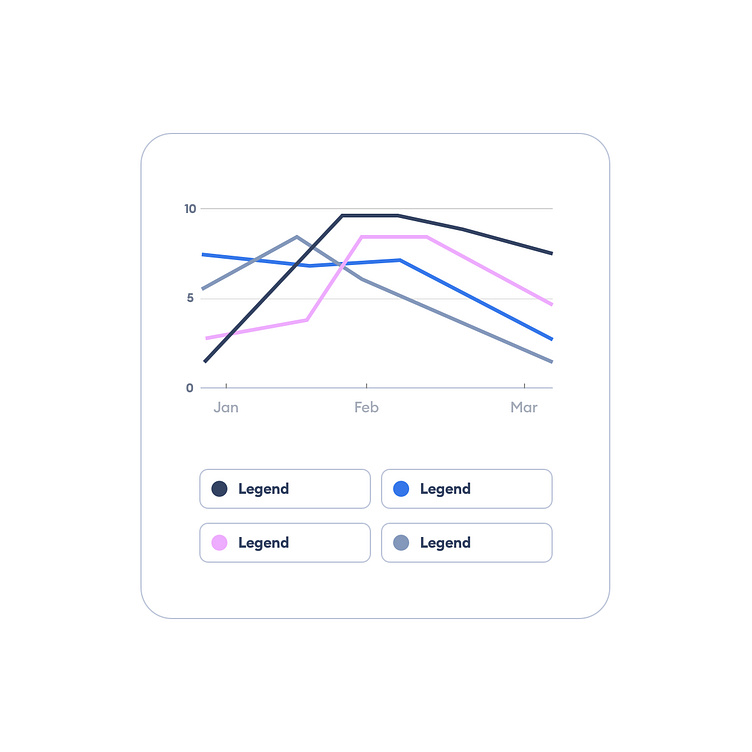
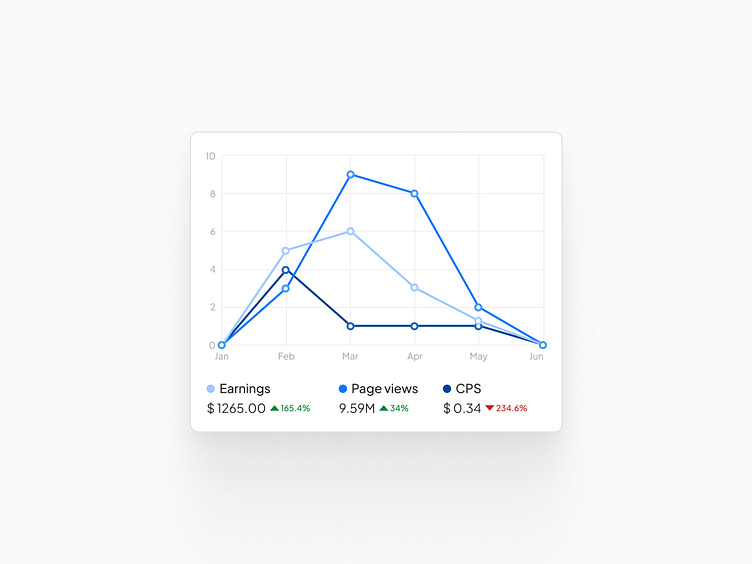
The task was to design a simple line graph chart (the wireframe is below).
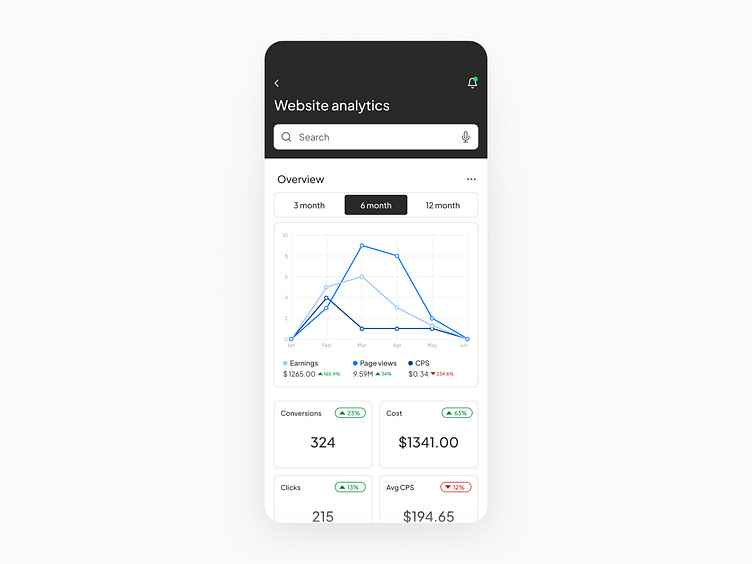
I decided that just a chart would not be enough for me. So I made a mobile app screen for site analytics to practice UI more.