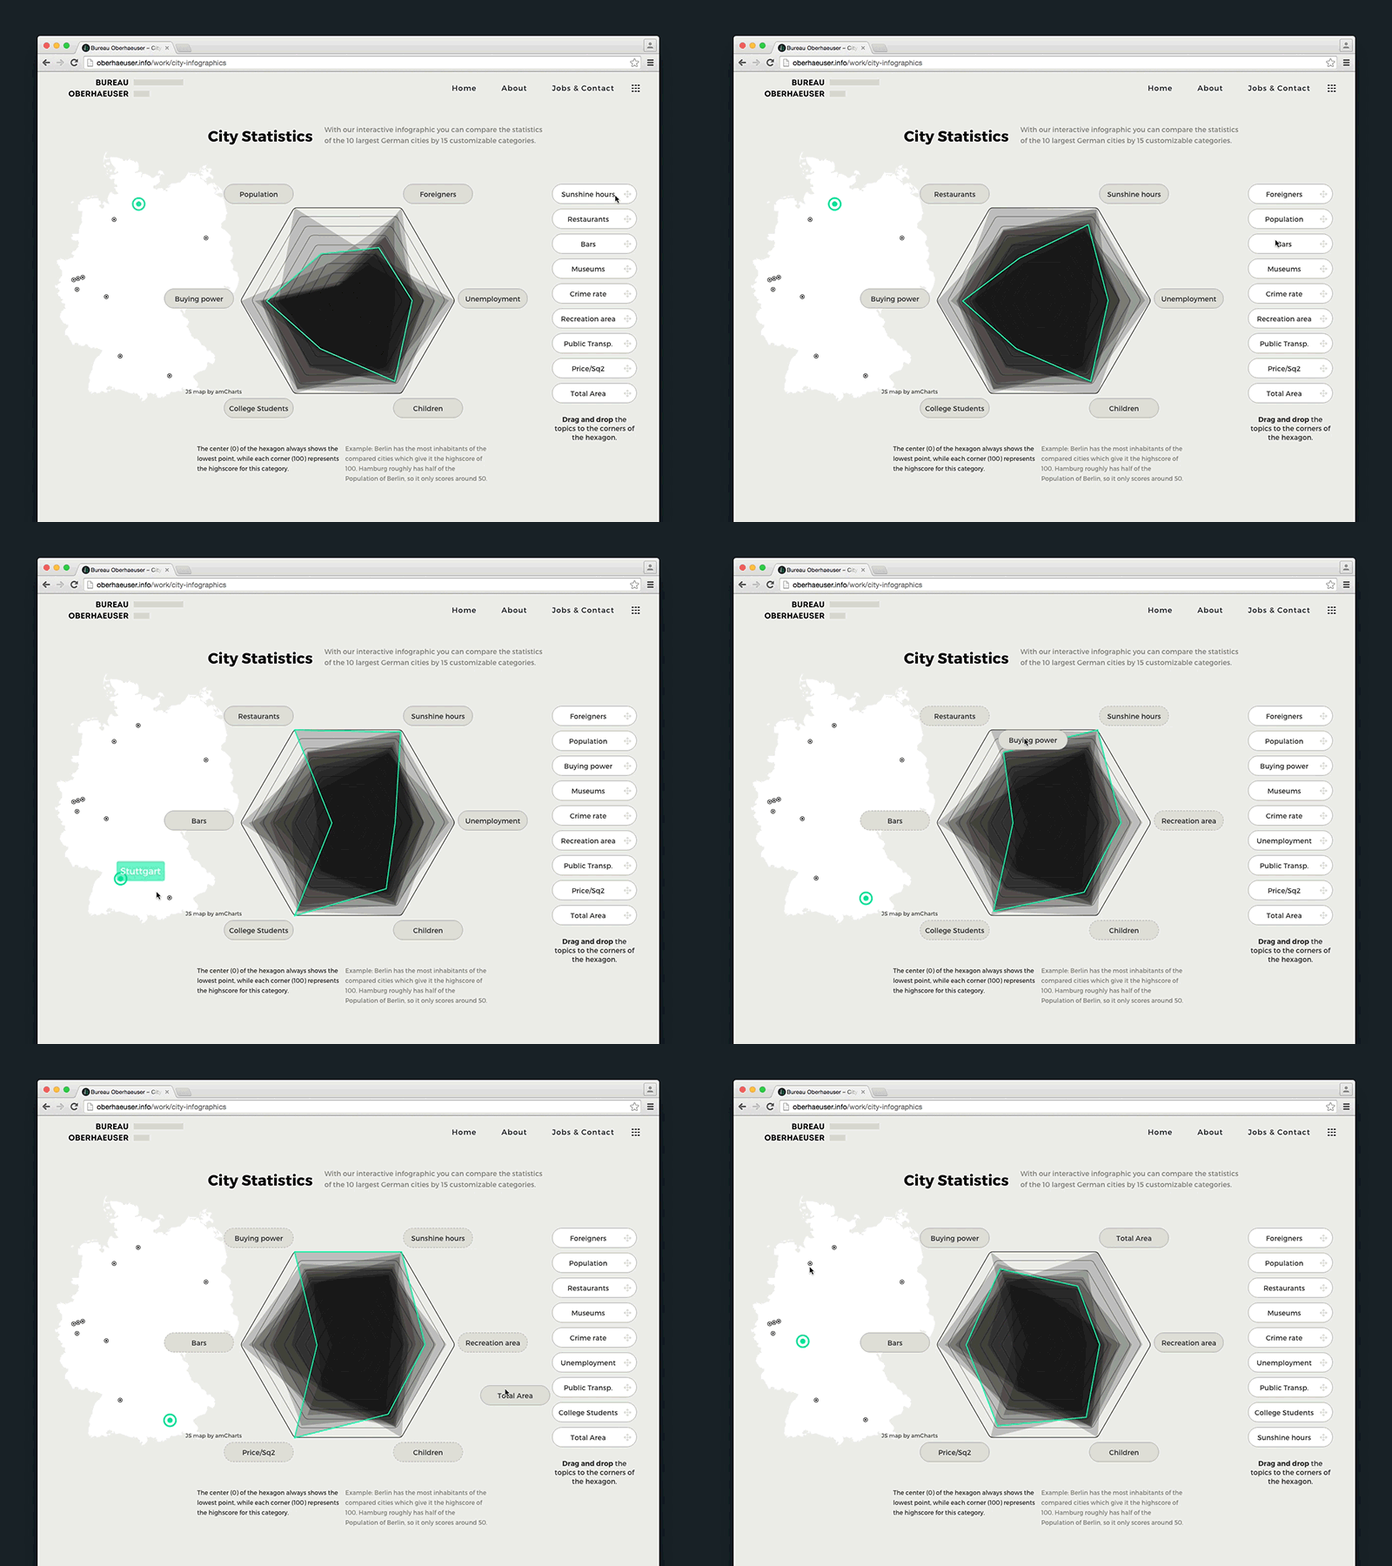
City Statistics Data Visualization
For our new website we build an interactive infographic to compare the statistics of the 10 largest German cities by 15 customizable categories. The center (0) of the hexagon always shows the lowest point, while each corner (100) represents the highscore for this category.
Check the live version here: www.oberhaeuser.info/work/city-infographics
stadtistik_02.mov
10 MB
More by Bureau Oberhaeuser View profile
Like
