DailyUI-Day21
📊 Visualizing Electricity Production: A Day 21 Data Tale ⚡📈
Hello, amazing Dribblers! 🌟
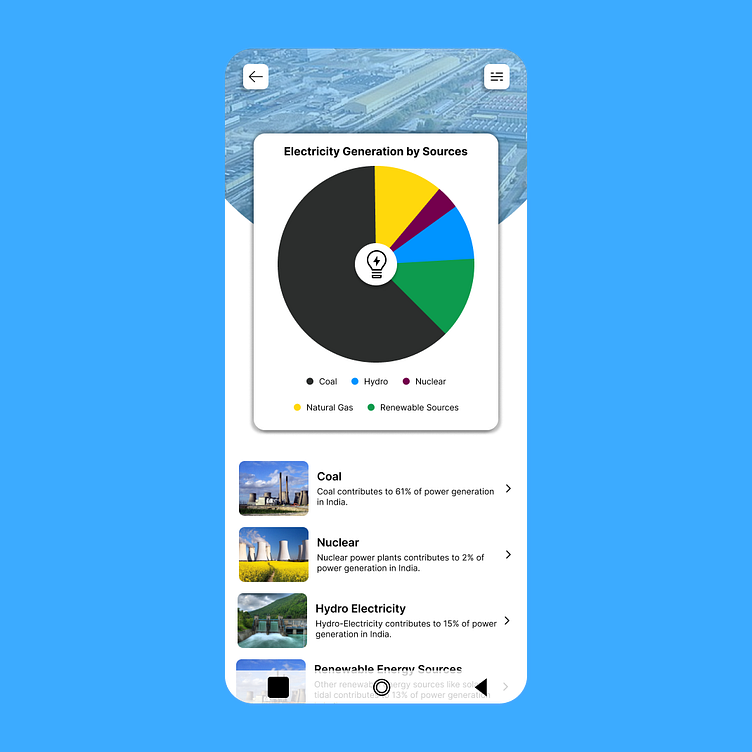
On this enlightening Day 21 of my DailyUI design challenge, I've ventured into the realm of data representation. The spotlight falls on the fascinating world of electricity production, where sources converge to power our lives. Take a look:
🔌 Powerful Sources: Energy Insights
Imagine a canvas that illuminates the energy landscape, with each slice representing the contribution of various sources. It's more than a graph; it's a story of how our world powers up.
⚡ Innovative Illumination: Charting the Energy Path
With a design that mirrors the dynamism of energy, this chart unravels the journey of power generation, showcasing each source's significance.
#DailyUI #DataVisualization #PowerfulInsights 📊⚡🔌
Connect with us: LinkedIn
Website: https://operandi.codes/