Bike Trip analytics Dashboard
Overview Section:
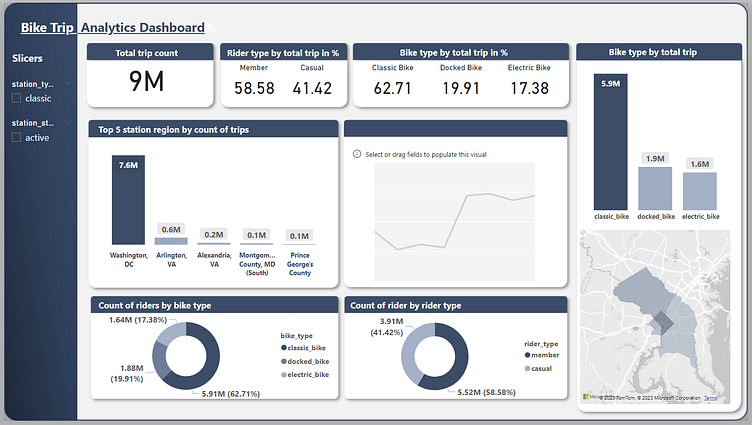
Display a visually appealing map highlighting the route of the bike trip.
Showcase key trip statistics like total distance, duration, average speed, and elevation gain.
Use vibrant colors to represent different segments of the trip.
Performance Metrics:
Include interactive graphs depicting speed variations, elevation changes, and heart rate throughout the trip.
Provide a breakdown of the top speed achieved, steepest incline/decline, and average heart rate.
Implement data points that users can hover over for more detailed information.
Geographical Highlights:
Design a section to showcase notable landmarks or scenic spots along the route.
Incorporate high-quality images of these locations to add visual interest
