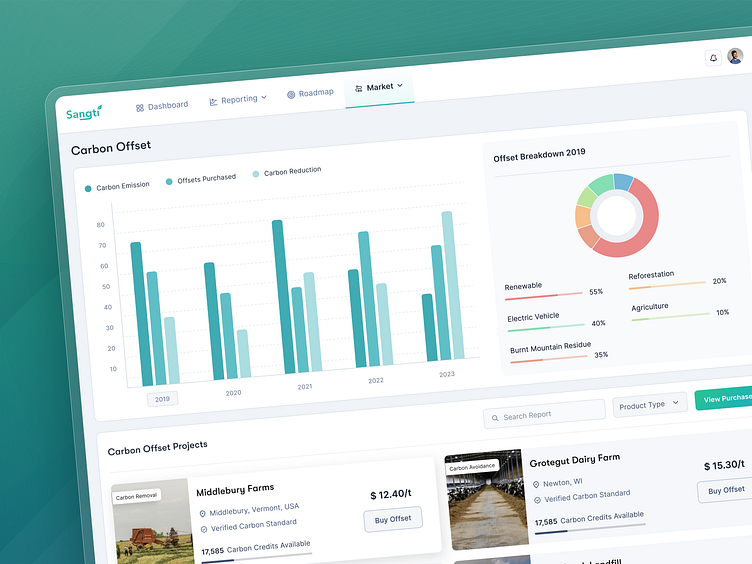
Carbon Offset Management, Dashboard, Graphs and Charts
Hii Dribbblers,
This is in continuation of the carbon management platform.
In the shot, we created an offset report to show carbon emission, carbon reduction and offsets purchased over a period of time.
We used bar graphs and other charts to show the breakdown to make it clean and informative interface.
What are your thoughts?
We are available for new projects!
We are experts in
Feel free to reach out to us at: business@octet.design
For more - Look at us on Octet Design Studio
Follow us on LinkedIn | Behance | Instagram | Twitter | Medium
More by Octet Design Studio View profile
Like
