Dribbble 2 Chart Retention View

We continue to work on retention. It's a primary use case for any product manager, marketer or data scientist to understand how a product or service acquires and retains users over time.
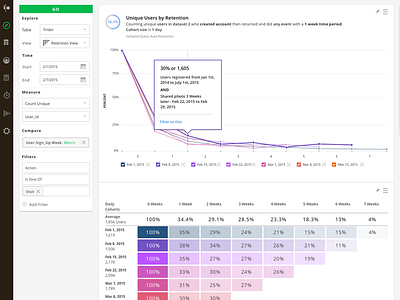
Making this functionality easy to use and understand is a challenge. This screen uses two visualizations to compare differences and understand what might be affecting your retention. As always there is a breadcrumb trail of questions one asks of the data. Interana is about exploration, iteration and delight to discover the insight that makes a difference.
Data should delight.
