Elevating E-commerce with an Intelligent Dashboard
Hey 👋👋,
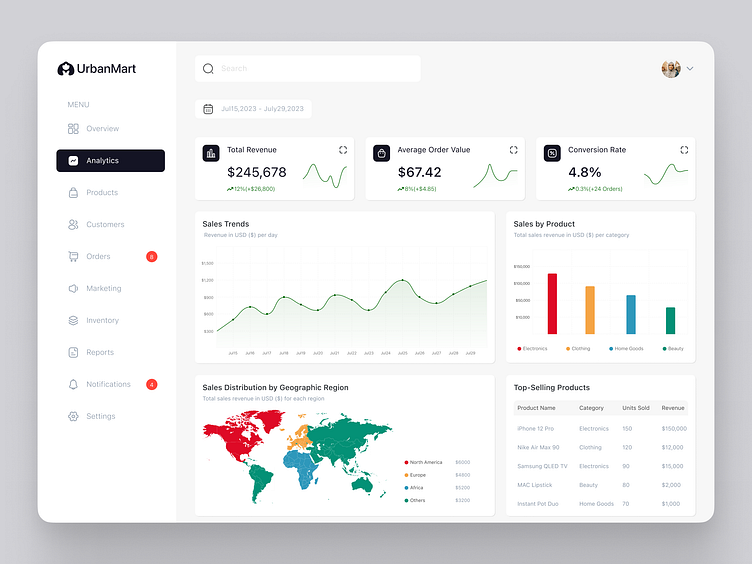
In this Dribble shot, witness the power of data with our cutting-edge e-commerce dashboard.
I've streamlined the user experience with a seamless Date/Time Selector, empowering you to choose the perfect date range effortlessly.
Discover the heart of your business with insightful KPIs, where Cards showcase total revenue, average order value, and conversion rate at a glance.
The dynamic Line Chart brings sales trends to life, while the Bar Chart boldly compares sales by product category.
A delightful Pie Chart represents sales distribution across geographic regions, delivering valuable market insights.
For a comprehensive overview, the Data Table presents the top-selling products, featuring product name,category, units sold, and revenue.
More by caXRi View profile
Like
