Data Broker Platform — Responsive Dashboard I
Hey Dribbblers!
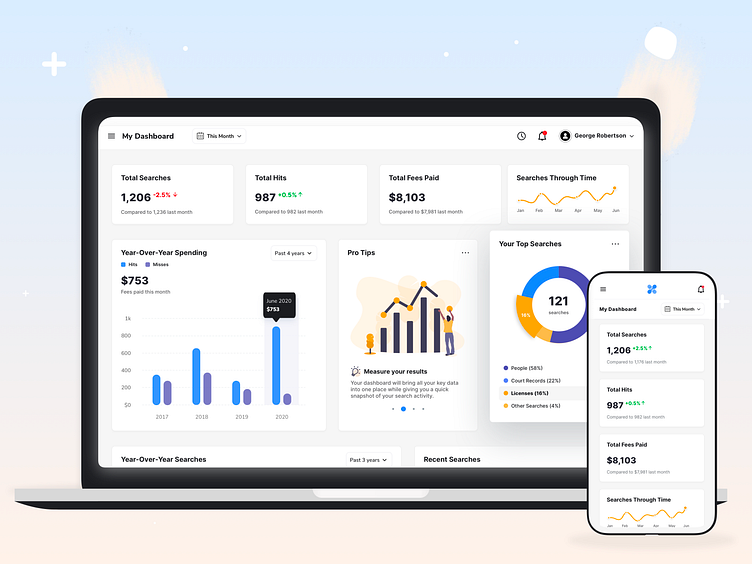
I'm thrilled to share a responsive KPI dashboard concept I designed for a data broker online platform. It uses a card-based layout, each one designed to give you quick hits of essential data right when you need it. From 'Total Searches' to 'Year-Over-Year Spending,' the cards aim to give you a 360-degree view of your business, and to get real-time insights and boost business growth.
Press 'L' if you love intuitive designs that make data digestible.
Cheers!