Economic Research Tool with Data Visualization Features

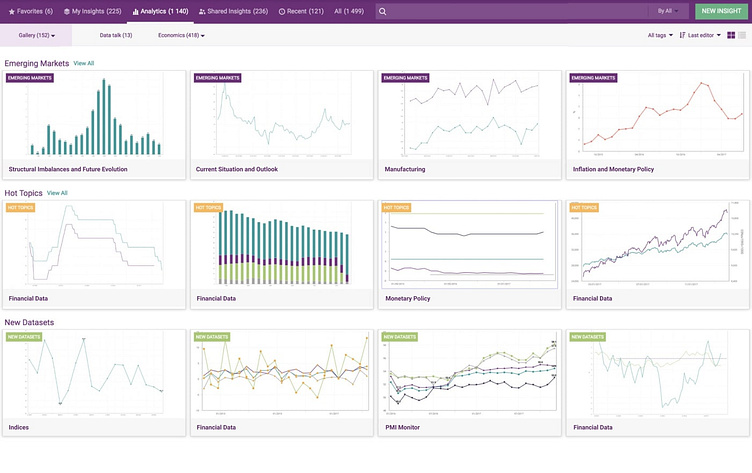
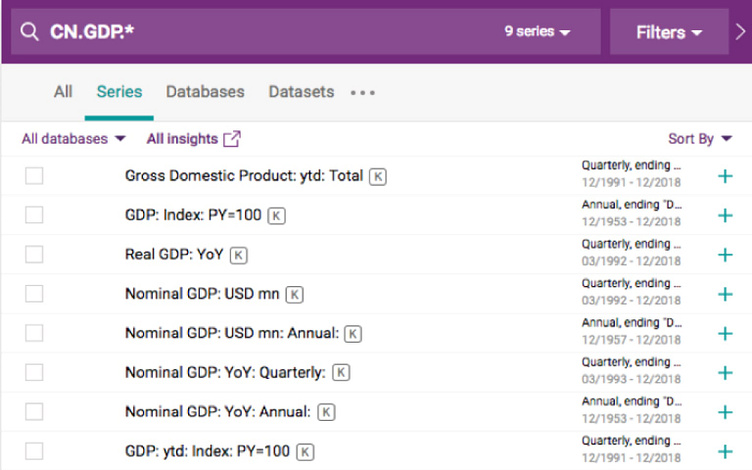
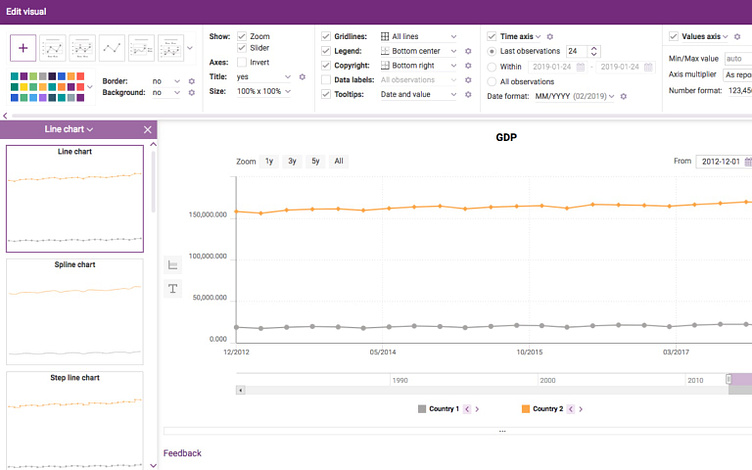
A comprehensive web-based tool for the analysis of core economic indicators and financial info with smart data visualization features. The application allows users to analyze leading economic indicators and financial data quickly and efficiently. Users can create personal insights using extensive data series.
Industry: FinTech
Technology stack: Webix, Node.js, Javascript, Websocket, Java, Python, Backbone.js, PhantomJS, Redis, Webpack, Highcharts, mongoDB, SaaS, Solr, Mocroservice, Gulp, Amazon Web Services EC2
Check full case study: https://xbsoftware.com/case-studies-webdev/economic-research-tool-with-data-visualization-features/