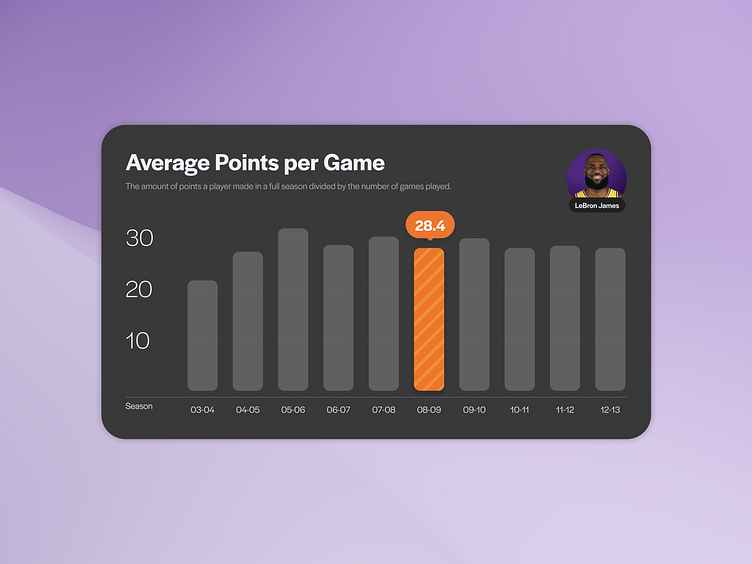
Basketball - Bar graph - Experiment
I always wanted to create sports dashboards.
Feels like there's so much data to compile and create new types of visualization.
It tried to bring a basketball feel to this graph by using the ball's orange as an accent color.
I would love to hear your feedback on this component ♥️
My portfolio is at: www.finaga.work
More by Finaga View profile
Like
