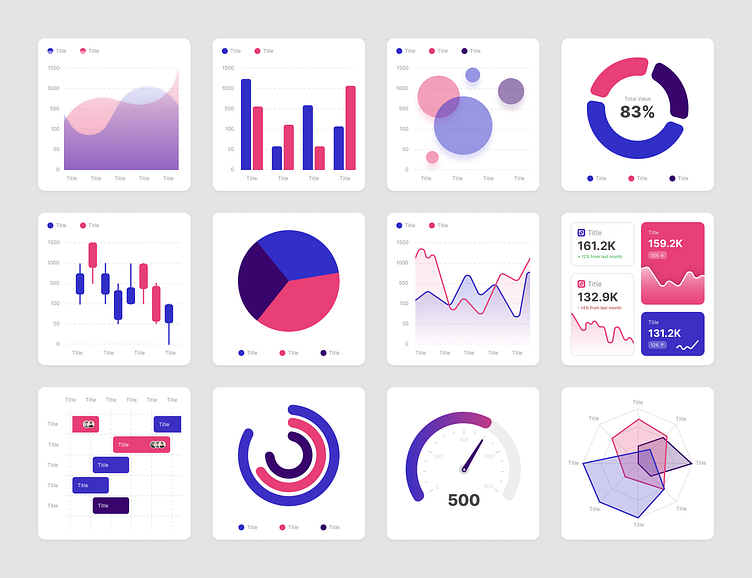
Data Visualization Dashboard (Inforgraphic)
Data Visualization Dashboard (Light Mode)
12 Style :
Area chart
Bar chart
Bubble chart
Donut chart
Candlestick
Pie chart
Line Chart
Score card
Timeline
Radial Bar
Gauge
Radar Chart
Hope it is useful, help appreciate this work with the love button, share, and provide feedback in the comments.
Available for freelancing or full-time work, contact me on
More by Mitaful Yudha Pratama View profile
Like
