Blueticket – Analytics
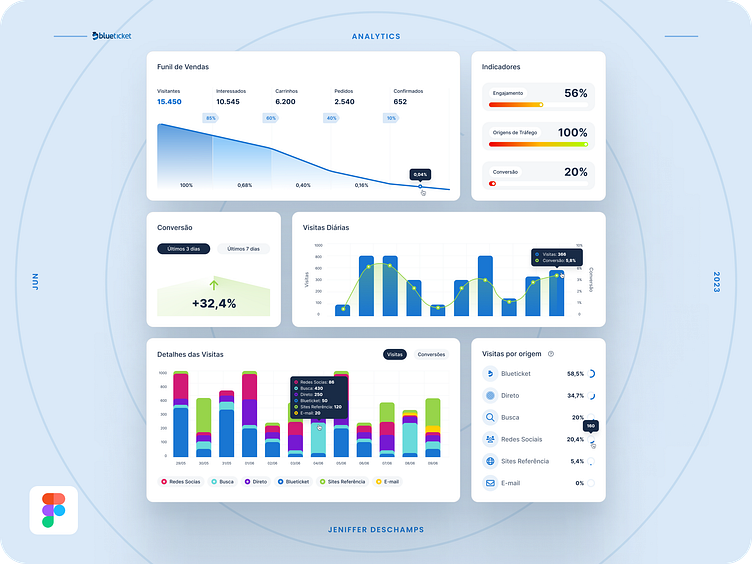
I recently had the opportunity to work on the redesign of Blueticket's Analytics, a leading platform in the ticket sales market. My main focus was to improve the key areas of the Sales Funnel, Indicators, Conversion, Daily Visits, Visit Details and Visits by Source. In this post, I'd like to share the improvements I've made to each of these elements and how they can benefit platform users.
Sales Funnel: Recognizing the importance of monitoring the sales process, I focused my efforts on making the Sales Funnel more intuitive and informative. Implemented clear and interactive graphical views to make it easy to understand sales progress at each stage.
Indicators: Implemented graphical views for the 3 types of indicators being engagement, traffic sources and conversion, each bar goes from red to green indicating percentage growth.
Conversion: This information allows users to identify bottlenecks and take corrective measures to improve conversion performance.
Daily Visits: Tracking daily visits is critical to understanding user engagement. I've improved this functionality by offering daily visit graphs with comparative analysis against previous periods.
Visits Details and Visits Origin: Understanding the importance of detailed information about visits, I added a specific section to explore the details of visits and improved the visits by origin section, which provides data about the traffic coming from.

