Dashboard 🍔 G Plots . Visualize your data
Case study ☞ G Plots . Visualize your data
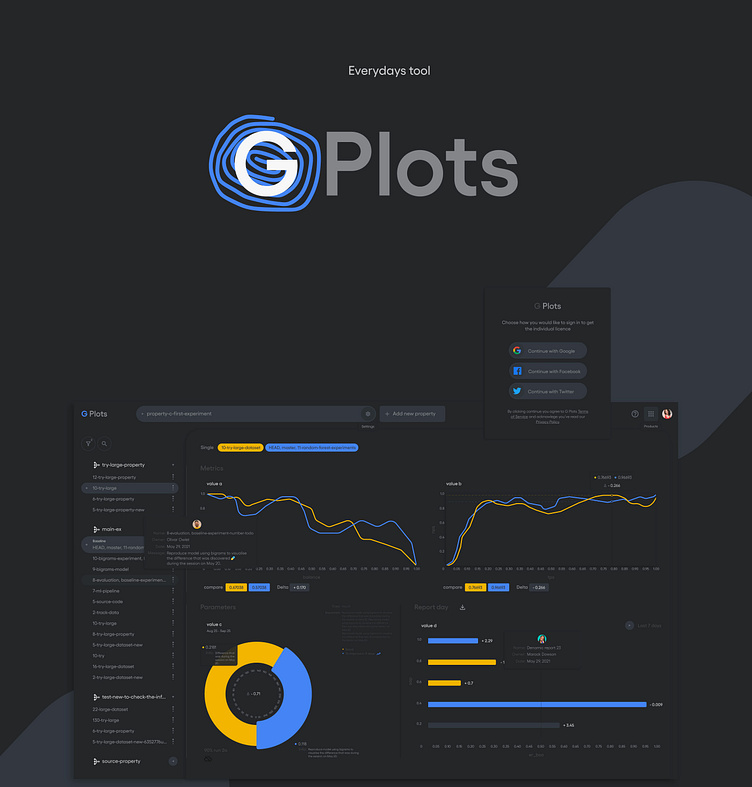
G Plots is here to help you organize your data in a view that can be most useful. The more you experiment - the better you will understand the materials that are currently taking your attention.
G Plots is a result of taking the system I am working on and transforming it into an imaginary product of Google. This is a time-consuming process, but this fact never stopped me. The result is obviously impressive and I feel that any minute of this exercise is worth spending.
꩜ In addition, you can find me on:
Behance · Linkedin · Instagram · Twitter · Medium
---