Sales Management Dashboard UI
A Sales Management Dashboard UI is a graphical user interface designed to provide sales managers with comprehensive insights and visualizations of their team's performance, sales data, and key metrics. Here are some features commonly found in a Sales Management Dashboard UI:
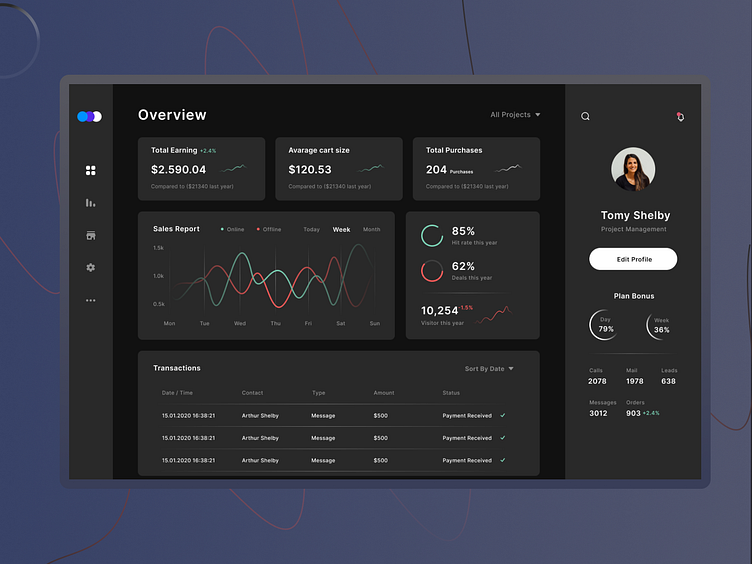
Overview Dashboard: The UI provides an at-a-glance overview of essential sales metrics, such as total revenue, sales growth, conversion rates, and top-performing products or services. This allows sales managers to quickly assess the overall sales performance.
Customizable Widgets: The dashboard allows users to customize and arrange widgets according to their preferences. Users can select specific metrics or charts they want to monitor, and drag-and-drop them into different sections of the dashboard.
Real-time Data Updates: The UI displays real-time data, ensuring that sales managers have access to the most up-to-date information. This allows for prompt decision-making based on the latest sales trends and patterns.
Sales Performance Metrics: The dashboard provides a range of sales performance metrics, such as revenue by region, sales by product category, customer acquisition rates, average deal size, and sales team productivity. These metrics help identify areas of improvement and track progress over time.
Visual Charts and Graphs: Sales data is presented through visually appealing charts, graphs, and other data visualizations. Common types include line graphs, bar charts, pie charts, and heatmaps. These visuals make it easier for sales managers to understand complex data and identify trends or anomalies.
Learn more: https://bit.ly/4113pCf
