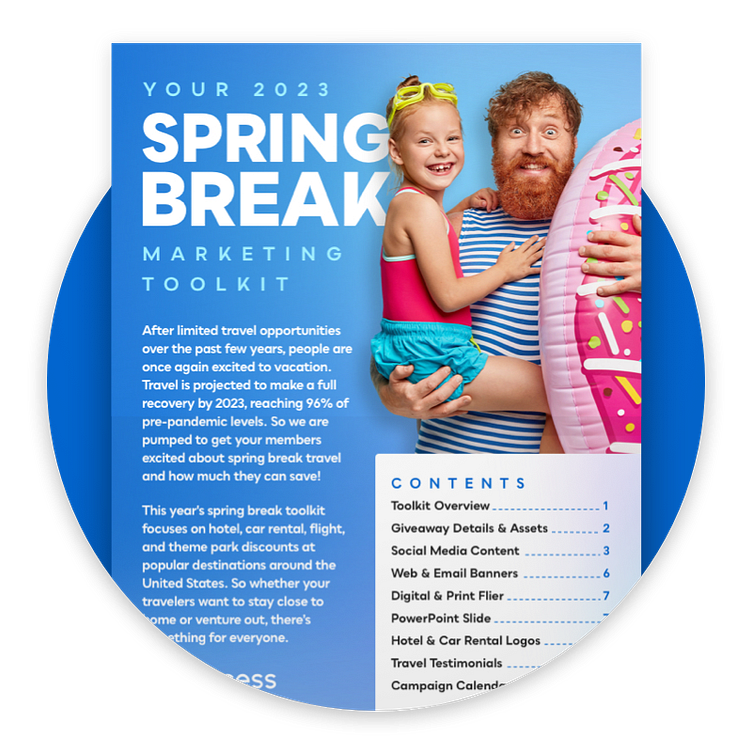
Case Study: Spring Break-Ation
Data
Campaign Stats: Jan 3-March 19
Total Bookings in Jan-March: 21,723
Year Over Year Increase in bookings Jan-March: 68%
Year Over Year Increase in Theme Park Bookings: 107.9%
Year Over Year Increase in Hotel Bookings: 58%
2022 VS 2023
Avg Unique Click/Email 1% .99%
Avg Redeems/Email 778 899
Avg Travel Redeems/Email 91 96
Avg Registrations/Email 478 339
Members (4,600 responses):
· 30% were aware of the campaign. Majority heard about it through an email from my discount program or membership organization
· 11% of those that participated used a deal: 45% booked a hotel; 30% saved at a restaurant; 26% bought theme park tickets; 24% saved on an activity; 18% booked a flight; 12% rented a car
· Of those that used a deal, 88% easily found what they were looking for and 89% were happy with what they saved
· 35% saved $50-$100; 34% saved $1-$50; 15% saved $101-$200; 10% saved over $200
· 70% did not use a spring break deal because they didn’t have travel plans; 11% had already booked their trip; 7% found better deals elsewhere
· Of those who were not aware of campaign, 67% said they read the emails
· 47% said they were planning on traveling 1-2 times this year; 42% said 3-5 times
· 38% said most the trips they take the drive to a location for a weekend getaway; 31% fly to a domestic location; 19% do a road trip with multiple destinations; 12% fly for international travel
· About 89% who are traveling this year are at least somewhat likely to book with us
· 49% planning a trip for this year are looking to book a car rental with 80% picking up at an airport
· 59% were 45+ in age; 69% female
_______________________________________________________________
Clients (50ish responses):
· 54% learned about the campaign via TAA, 20% from CSM, 11% from Sales Rep, and 2% from CMP
· 13% didn’t know about campaign
· 42% used the toolkit to promote the campaign
· 58% didn’t use the toolkit because: 1) Didn’t Have Time or Access already sending Emails for us 2) 14% didn’t understand how to use toolkit – most that said this didn’t see the toolkit or got it too late
· Most important assets: 1) Banners & SM 2) Flier 3) Testimonials 4) HTML/Car/Hotel Logos 5) PP Slide
· Most used assets: 1) SM 2) flier 3) banners
· 93% were satisfied with toolkit assets
Client Comments:
-We liked having this toolkit to help market the program to our employees!
- We have had a very positive experience. We will continue to market and let our word of mouth work its wonders.
-Received likes on social media.
-Our marketing team was able to work on campaigns faster with all the resources provided.


