edX Insights: Video Performance
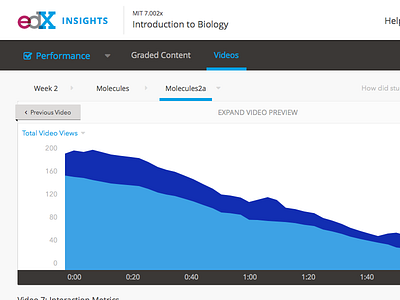

The following shows the navigation and chart visualization for data coming from students watching a video. Video plays and replays are stacked, showing drop off rates as well as frequently replayed seconds of a video. Controls for expanding the video in-context as well as jumping backward or forward through the course videos are also included. (In the full screenshot attached you can also see the legend and associated heads up metrics about the video shown.)
Our team is now on dribbble! Follow us here: https://dribbble.com/edXOnline