Market Research- Survey Dashboard, Graphs and Charts
Hii Dribbblers!👋🏻
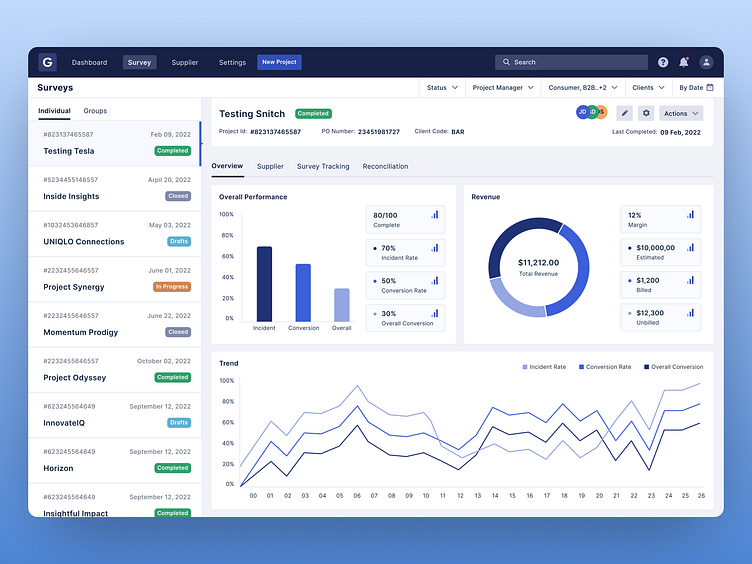
We made a survey dashboard for a Market Research platform.
On the left side of the interface, we provided an option to show all the surveys and their status which are highlighted in different colours.
We also provided a filter option to the users based on certain categories which is shown on the top right corner of the screen.
The centre of an interface is used to show all the bar charts and graphs based on the survey and filter you selected.
We used different shades of blue to help you interpret the data easily and make it a user-friendly interface.
What are your thoughts on this design?
Let us know in the comments below.
We are available for new projects!
We are experts in:
Feel free to reach out to us at: business@octet.design
For more - Look at us on Octet Design Studio
Follow us on LinkedIn | Behance | Instagram | Twitter | Medium