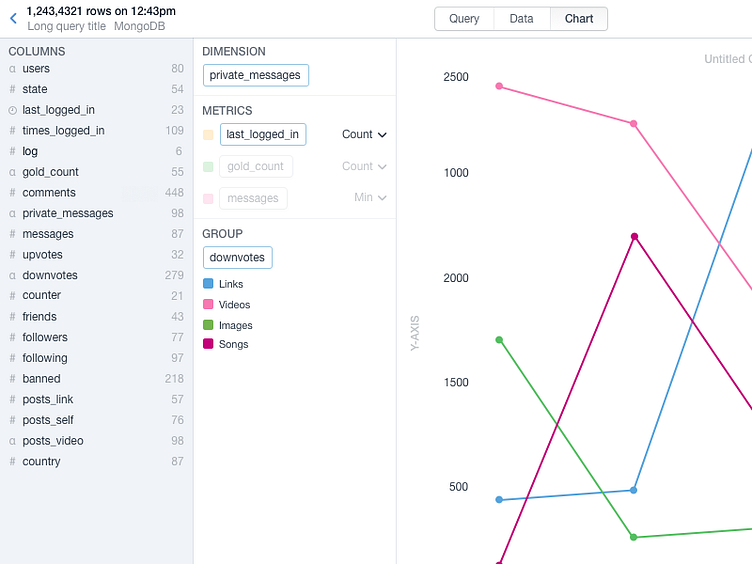
Chart builder
I recently had the pleasure of helping Wagon with designing their interface.
The challenge was to turn a very technical product into something most people can understand.
This page allows you to build a chart by dragging and dropping database data points. And share them with others.
Wagon is a better way for analysts and engineers to write queries, visualize results, and share data & charts.