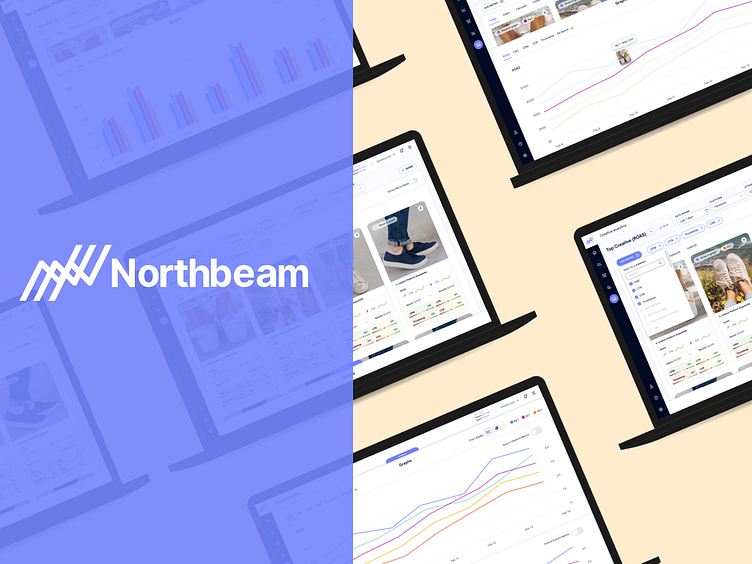
Northbeam - Creative Analytics
Creative Analytics is a web-based experience built into the Northbeam web app platform where you can view all your ad creatives in a simple way.
Challenge
For brands running ads across various social media platforms, it's crucial to see what visuals are performing the best and worst, to make informed decisions when deciding to scale or cut ads.
Creative Analytics Main Interface Overview:
Creatives listed out in Card view (with 4 supporting metrics by default) you can swap these in and out.
Cards are heat mapped: That means across all ads that have run during the time period selected it's showing you the overall performance of each ad.
Saved Views: You can save different views that you want to remember and see on a consistent basis.
Group Ads by Name: Via different naming conventions ex. 50 ads with the same name across Facebook
Graphs Overlayed to pull up from the bottom of the screen
Project time frame: 1 month (for designs) additional time for development
Team: Myself, 1 Product Manager, 1 Engineer, 1 Data Scientist. I also collaborated with another designer
Step 1: Market Research
The first step I took was to compile market research to find existing companies that offer a similar service. I compared Triple Whale, Motion, and the platforms the ads run on: Meta, Google etc.
Step 2: Interviews
I surveyed some of our existing e-commerce clients using Typeform and Zoom interviews. Here are some of the recurring themes of importance.
I want the ability to able to see the performance of Ad Creative in a single dashboard view
I want to be able to share top-performing creatives with the rest of my team
I want to be able to see how an individual creative is performing across different stages of my advertising funnel
I want to be able to see how the same creative is performing across different platforms
I want to be able to see how dynamic creative is performing by variant
Step 3: User Flow
From there I collaborated with the project PM to come up with the user stories and functionality. For the first version, we would launch with the following functionality:
4 input dropdowns: To control (Time frame, platform, etc).
6 Tabs: To change the different Ad views ( Ad formats: Video, Image, Carousel, etc).
Creative cards: Showcase the Ad Creative and display the data.
Add Metrics to cards: To show 4 metrics at once
Graphs: View graphs on the selected metrics.
Saved views dropdown: To manage and save new views
Share saved view: Share screen view via link
Next below I roughly mapped out a wireframe/user journey of all the screens and functionality to satisfy the requirements.
Step 4: Wireframes
Next, I worked on a series of wireframes to figure out how to best display the requirements and reviewed them with the team. We tried out several versions of how to display the graphs. (At the top, or the bottom - Split screen).
We decided to go with a split screen that slides up and down when you tap it, although it was more unconventional since this tool was for creatives we wanted to make the experience a bit more unique.
Ideation #1: Graphs are at the top of the screen with the option to expand to see the full graphs
Ideation #2: Graphs are accessed from the bottom of the screen and pulled up to an overlay
The Evolution of the Creative Card
As you can see this took many passes. There were even more iterations.. these are just a few. The card on the very right is the final design we went with. We relied heavily on a few users (media buyers - to get feedback and also collaborated heavily as a team to make decisions.
Step 5: Visual Design
This was a very exciting time. We were also working on the new style guide and Northbeam rebrand that I contributed to. I worked with 1 other designer as well as an internal Ad Agency.
Our Brand New Style Guide
Step 5: Visual Design
After testing my prototype on more of our users and incorporating in the feedback loops. I created the final designs for our V1 launch. I also created many new components to add to our growing Figma library.
Prototype
Here is the prototype of the final designs for launch. We will continue to test measures and make adjustments to deliver the best experience possible to our growing base of customers!
Enter your text here...


