Visualizing Carbon Saving and CO2 Emission: A Dashboard Design
As the world becomes more conscious of climate change and its impact on our environment, carbon-saving initiatives have gained momentum. From renewable energy to sustainable transportation, people are looking for ways to reduce their carbon footprint. To help individuals and countries track their carbon-saving efforts,
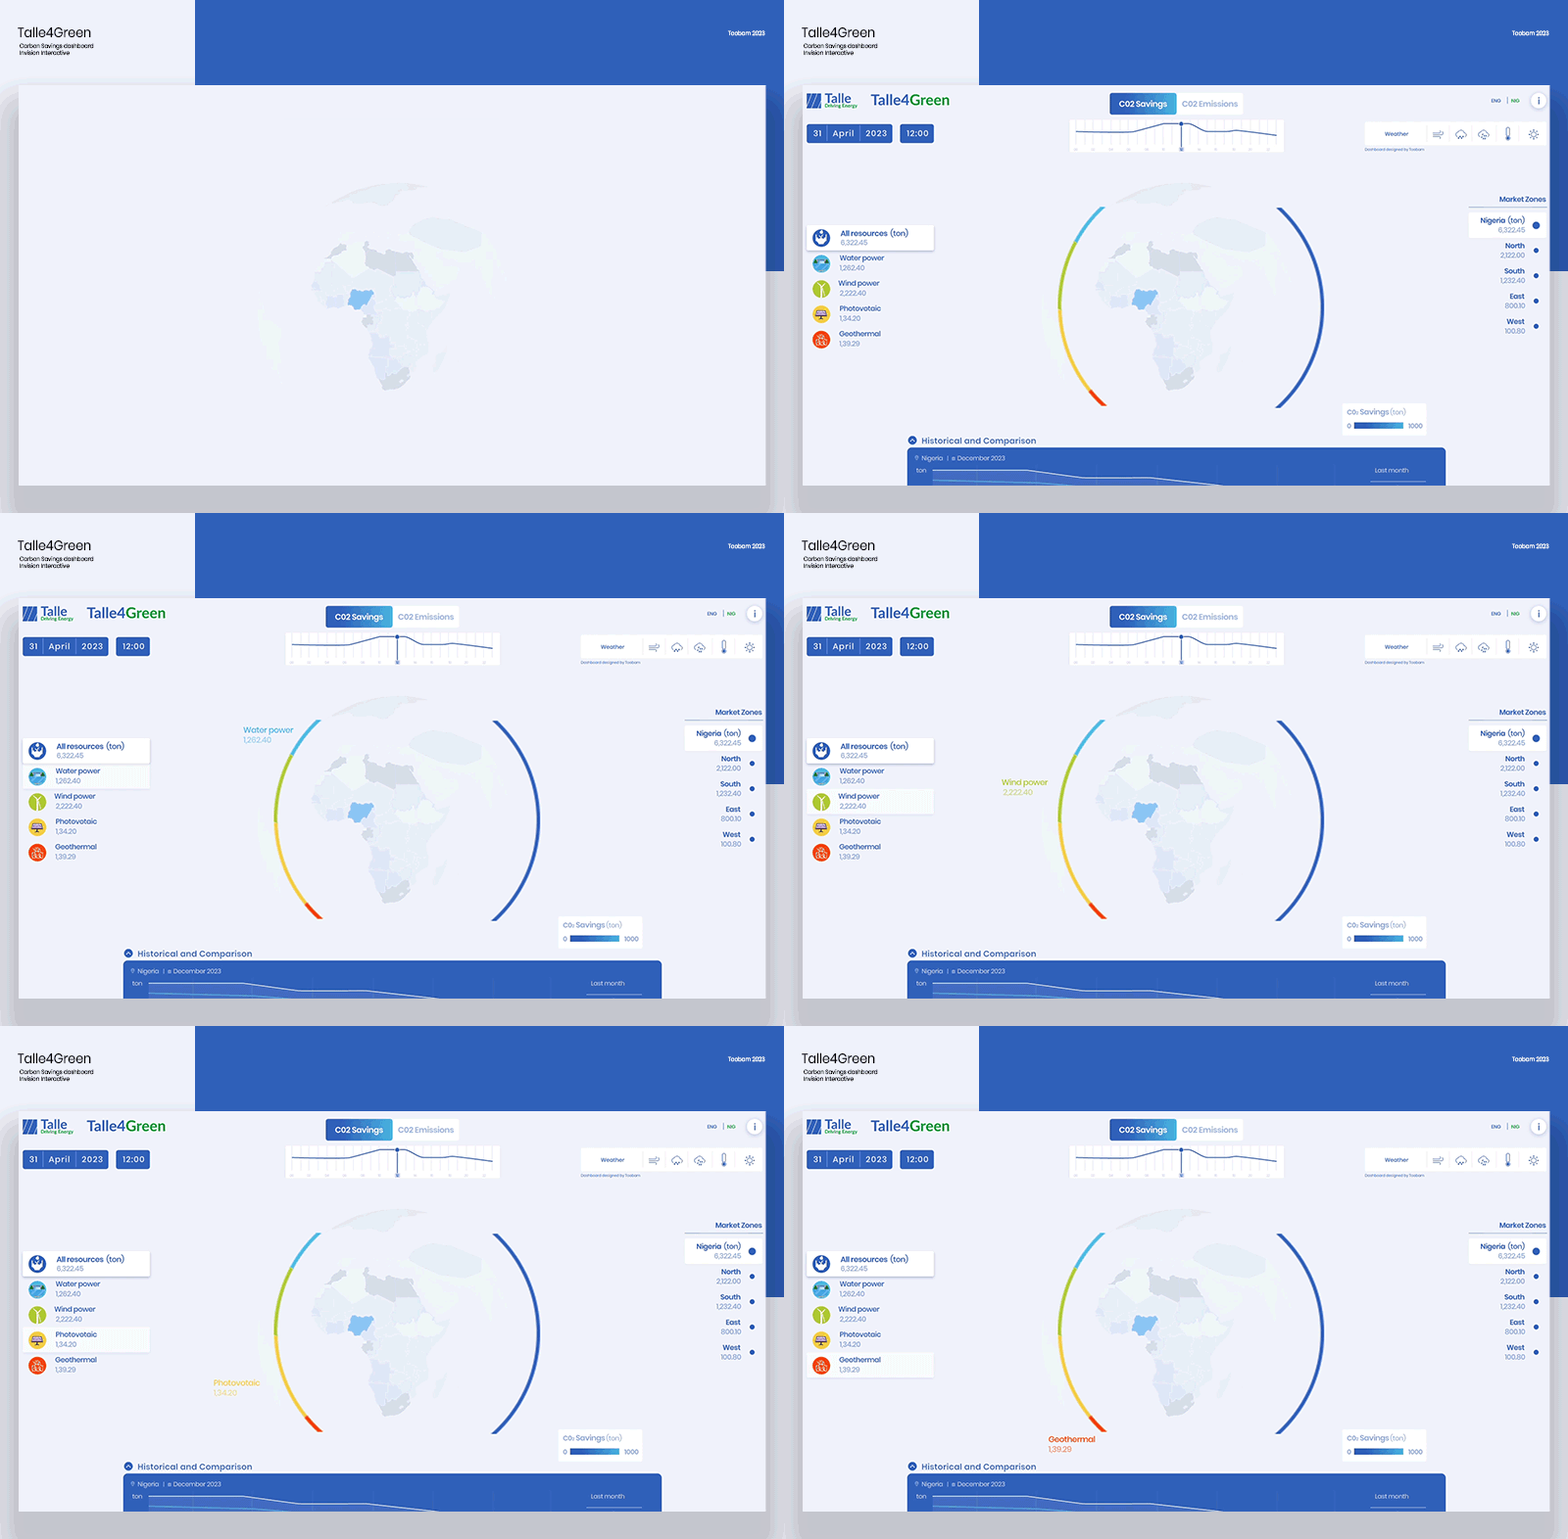
I created a dashboard that visualizes carbon-saving and CO2 emission data for one of Africa country, Nigeria.
Design Features:
The dashboard features a clean and modern design with easy-to-read charts and graphs that display data on carbon saving and CO2 emissions. It also allows to set goals and track carbon emissions and savings progress over time.
Benefits:
*A clear understanding of carbon emissions and savings Insight into which part of the country is contributing to emitting and saving of carbon in Nigeria
*Motivation to make changes and reduces their carbon footprint.
