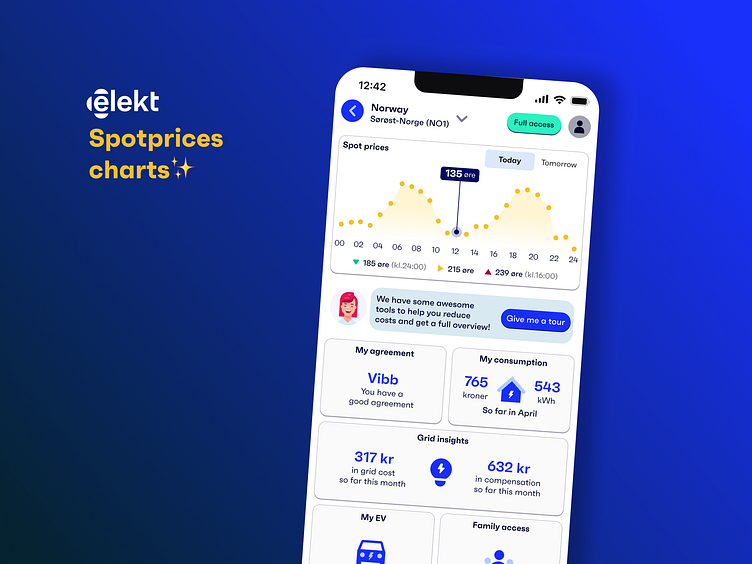
Spotprices design | chart types
CLIENT:
Elekt is an electricity supplier in Norway. The company's ambition is to offer customers an extensive application with the latest possible features.
Spotprices view is a data visualization tool that allows users to view data related to electricity usage over time. The tool offers three different chart types for users to choose from: a table view, a bar chart, and a line chart.
The data being displayed is related to ongoing electricity usage over the course of a day, with changing amounts being shown for each subsequent hour. By allowing users to customize the view in a way that shows the amounts in the clearest way for them, the tool provides a high degree of flexibility and user control.
Have a good day ⚡️
—
We're always open to new projects and challenges.
Just drop us a line at info@neurosys.com.
—
Don't forget to press L if you like the project! Thanks!

