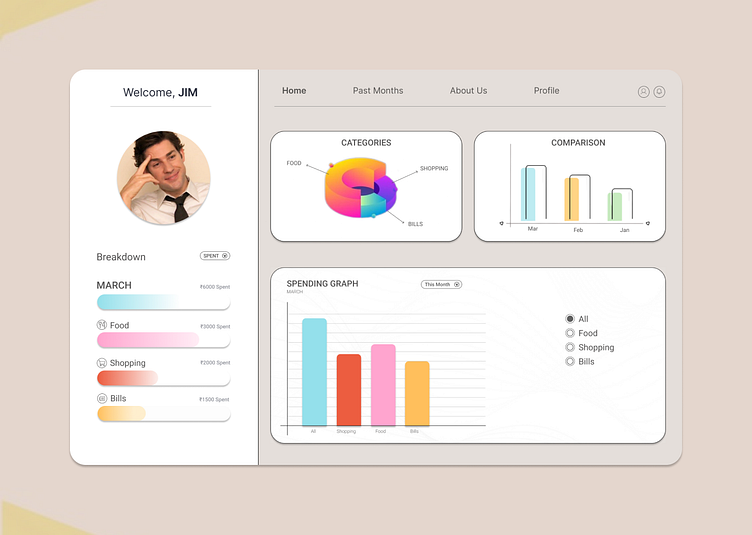
100-Days UI | Day 18 | Analytics Chart
Introducing a personal finance analytics board with features to track expenses, compare previous months, and view a 3D pie chart of spending. The design is minimalistic and easy to read.
Feedbacks are much appreciated
More by TANMAY SHRESTH View profile
Like

