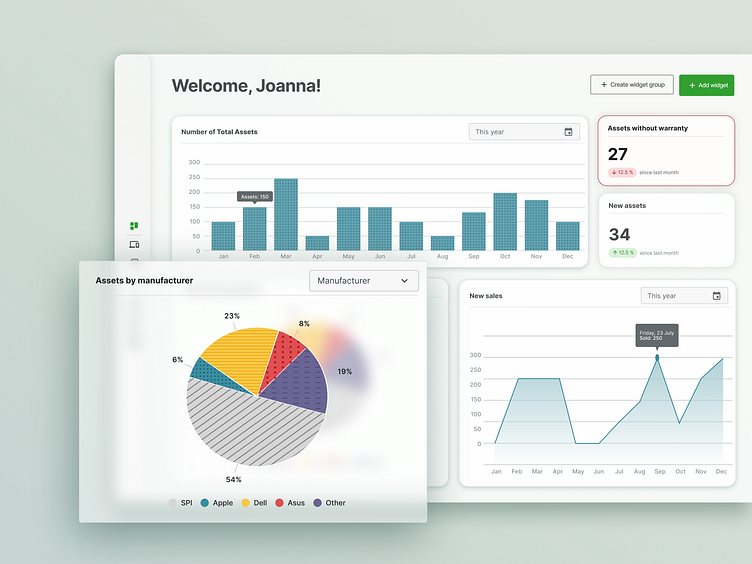
Dashboard chart
Challenge: design the dashboard graphs with accessibility in mind
Solution: We have added patterns to each color to make it easier to read for people with color disabilities. We also show the values under each part of the chart that is active.
More by etteplan design team View profile
Like
