Warehousing and Transportation Dashboard - Case Study
User Onboarding
1. User navigates to the Login page.
2. User is presented with a login form that asks for their mobile number and a one-time password (OTP).
3. User enters their mobile number and clicks the "Send OTP" button.
4. The system sends a unique OTP to the user's mobile number via SMS.
5. User enters the OTP they received and clicks the "Submit" button.
6. The system verifies the OTP and if it's correct, the user is logged in and directed to their dashboard.
7. If the OTP is incorrect, the user is prompted to enter it again or request a new one.
New User onboarding
1. User navigates to the Registration page.
2. User is presented with a registration form that asks for their first name, last name, email address, and mobile number.
3. User enters their personal information and clicks the "Submit" button.
4. The system validates the information entered by the user and sends a unique OTP to the user's mobile number via SMS for verification.
5. User enters the OTP they received and clicks the "Verify" button.
6. The system verifies the OTP and if it's correct, the user's information is saved in the system and is sent to the back-end team for further processing.
7. The back-end team performs the new user onboarding process, which may include additional verification steps, and notifies the user via email or SMS once the process is completed.
8. The user can now log in using their mobile number and the OTP sent to them.
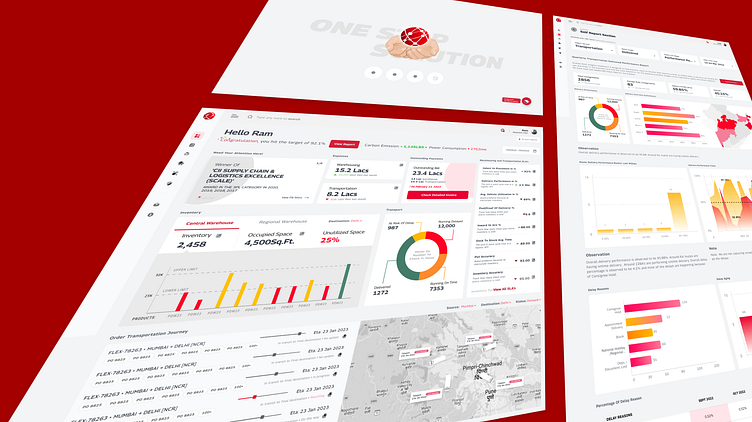
Landing/Dashboard Screen
1. The dashboard displays an overview of the user's warehouse and transportation activities, expenses and invoices, inventory status, and transport status.
2. The Expenses section displays the user's warehouse and transportation expenses in separate cards.
3. The Warehouse Expenses card displays the user's current month expenses on warehouse activities compared to last month's expenses. The user can click on the card to view more detailed information, such as a breakdown of expenses by location, type of activity, or other relevant parameters.
4. The Transportation Expenses card displays the user's current month expenses on transportation activities compared to last month's expenses. The user can click on the card to view more detailed information, such as a breakdown of expenses by location, mode of transportation, or other relevant parameters.
5. The Outstanding Payments
a. The user's pending bills and due date notification data in separate cards. This section is designed to help users keep track of their pending payments and ensure they are paying their bills on time.
b. The section include information such as the name of the vendor or supplier, the amount due, the due date, and the status of the payment (e.g. paid, unpaid, overdue). The cards also include buttons or links that allow the user to view more detailed information about the bill or payment, or to make a payment directly from the dashboard.
c. Overall, the goal of the Outstanding Payments section is to help users stay on top of their financial obligations and avoid late fees or other penalties. By providing a clear overview of their pending payments, users can easily see which bills need to be paid and when and take action to stay on top of their finances.
6. The Inventory section displays the user's inventory status from the central and regional warehouses, with an occupied unutilized space in the same card location filter to check location-wise warehouse data. The section also shows the product inventory and a graph displaying the lower and upper limits of the product inventory availability.
7. The Inventory section displays the user's central and regional warehouse inventory in separate cards.
8. The Central Warehouse Inventory card displays the user's current inventory status for products stored in the central warehouse. The card also shows the occupied and unutilized space in the warehouse, allowing the user to see how much space is currently being used and how much is available. Additionally, the card displays an indicator for each product's lower and upper stock limit, which allows the user to monitor inventory levels and plan for replacement or space management.
9. The Regional Warehouse Inventory card displays the user's current inventory status for products stored in regional warehouses. The card also shows the occupied and unutilized space in each warehouse, allowing the user to see how much space is currently being used and how much is available. Similarly, the card displays an indicator for each product's lower and upper stock limit.
10. The Transport
a. The Transport section displays the user's in-transit and delivered data in separate cards.
b. The Delivered data section displays the user's on-time and delayed deliveries in separate cards. The user can see the number of deliveries that were completed on time, and the number that were delayed, along with the average delay time.
c. The In-Transit data section displays the user's at-risk of delay, running delayed, delivered, and running on-time transport data in separate cards.
d. The user can see:
i. The number of transport orders that are currently in transit.
ii. How many are at risk of being delayed, how many are running late.
iii. How many have been delivered.
iv. How many are running on time. On mouse hover, the percent value of each respective section is displayed.
e. The user can click on card to view more detailed information, and can filter the information by date, location, or other relevant parameters.
11. The Delivered data section
a. The on-time deliveries section displays information about all the deliveries that were completed within the expected delivery time frame. It may include details such as the delivery date, time, location, and any relevant notes or comments.
b. The delayed deliveries section displays information about all the deliveries that were completed after the expected delivery time frame. This section may also include details such as the delivery date, time, location, and any relevant notes or comments explaining the reason for the delay.
c. The purpose of this section is to provide the user with an overview of their delivery performance, allowing them to monitor their on-time delivery rate and take steps to improve it if necessary. The information provided in this section can also help the user identify any recurring issues that may be affecting their delivery performance and take appropriate corrective actions.
12. The user can click on each card to view more detailed information, and can filter the information by date, location, or other relevant parameters.
13. The user can navigate to other sections of the app using the navigation menu on the left-hand side of the screen.
14. Order Transportation Journey
a. The live Order transportation journey section of the Transport section on the user's dashboard displays real-time information about their ongoing transportation operations. This section provides the user with a live view of all the trucks currently on the road, the number of orders in each truck, and the live GPS location of each truck.
b. The section is divided into cards, each of which displays information about a specific truck. The cards may include details such as the truck number, driver name, truck capacity, and the number of orders currently loaded onto the truck. The cards also include a map displaying the live GPS location of the truck, along with its current direction, and estimated time of arrival (ETA) at the destination.
c. “In addition to the truck-specific information, the live Order transportation journey section also display a summary of all the trucks currently on the road, the total number of orders in transit, and an estimated delivery time for each order. This information can be helpful for the user to keep track of their ongoing transportation operations and ensure that all orders are being delivered on time.”
15. Warehousing and Transportation SLA’s
a. The SLA's can be displayed in the form of a progress bar or a percentage value.
i. For example, if the agreed Indent vs Placement percentage is 95%, and the service provider has achieved an accuracy of 92%, then the completion status for this SLA can be displayed as 92/95, indicating that the service provider has fulfilled 92% of the agreed target.
b. Similarly, the completion status of the other KPIs such as Delivery Performance, AVG. Vehicle Utilization, and POD percentage can also be displayed in a similar format.
The Warehousing and Transportation SLA's section can also provide additional details about the SLA's, such as the agreed targets, timelines, and penalties for non-compliance. This information can help the user to track the service provider's performance and take corrective actions if necessary.