Starlight
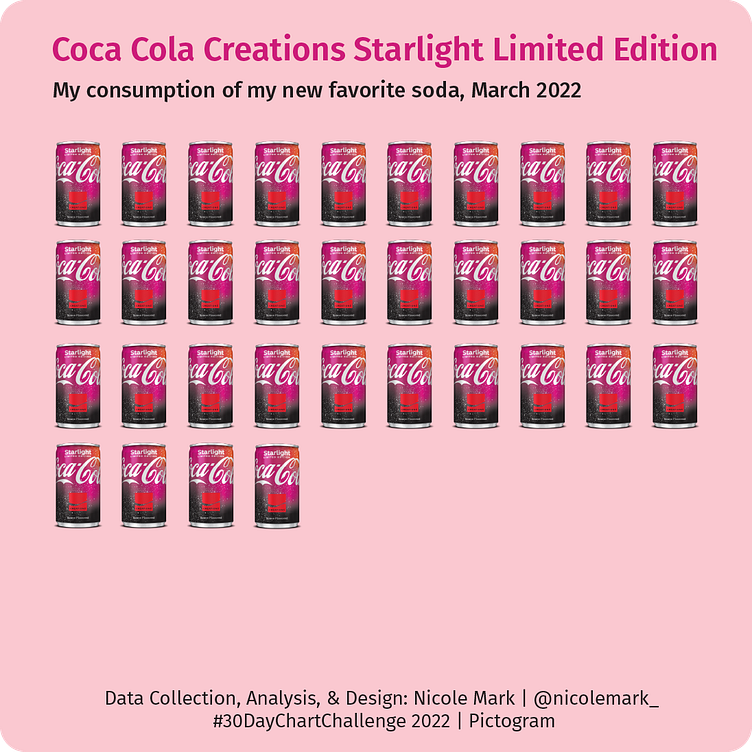
A pictogram uses images or symbols to represent data. Each image has a numerical value. In this chart, each can of soda represents one can of soda that I drank during March of 2022. (More than one per day!)
Tools: Adobe Illustrator
Data: Self-collected