Data visualization case study

Project overview
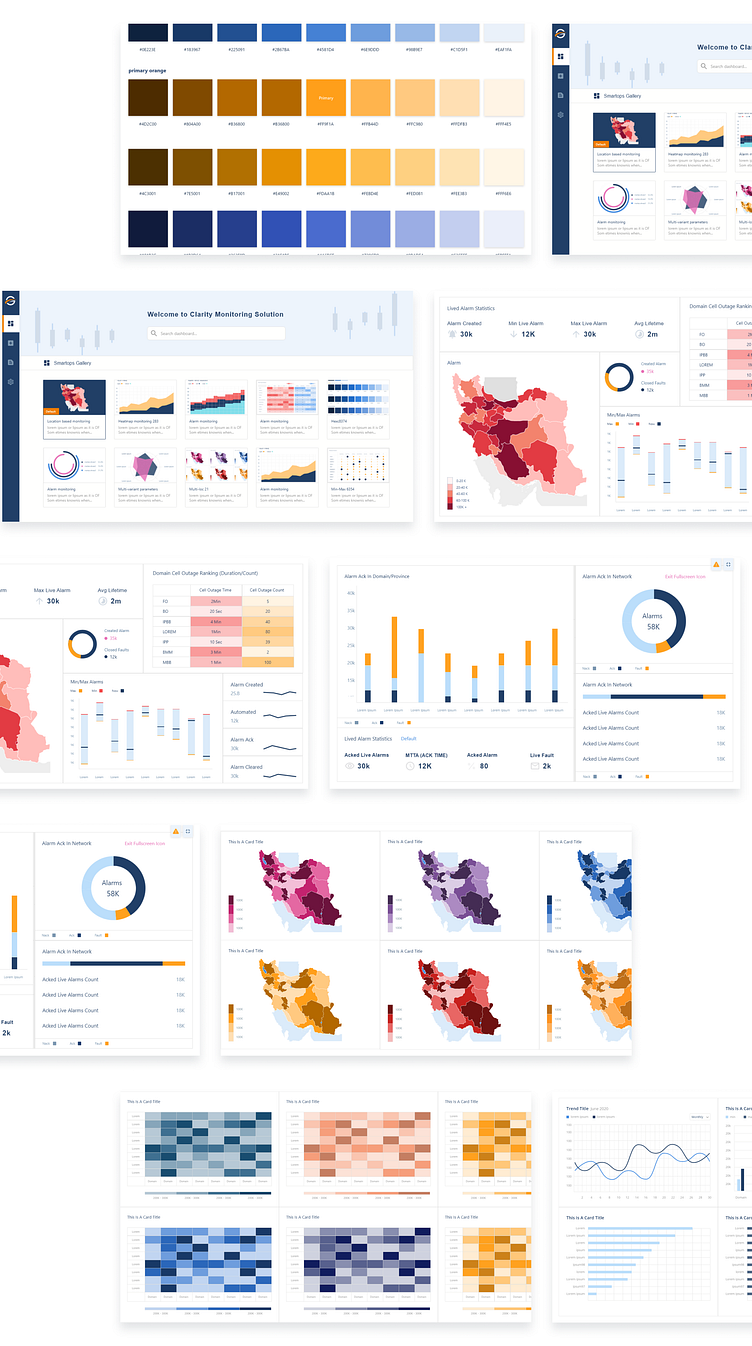
Monitoring dashboard is a set of metric groups or custom views that you can use to monitor the performance of the systems defined in the System Status task.It gives you clear sight of the areas that immediately need action or further attention because something has recently changed.
Problem statement
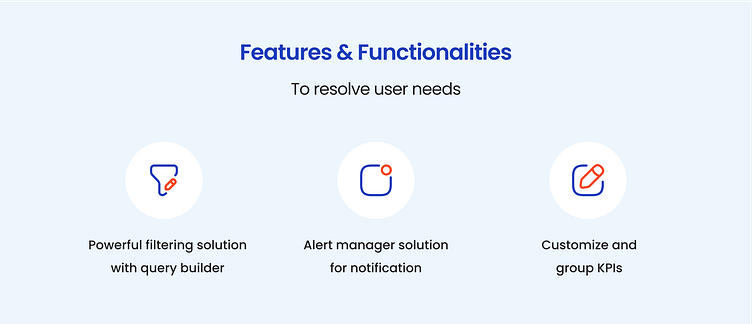
Due to a large amount of critical data, Which affects the business, There is a need for a monitoring system to categorize, customize and monitor KPIs based on user needs.
Objectives & Goals
Total Visibility into Your Business
Big Time Savings
Reduced Stress
Improved Results
Increased Productivity
Increased Profits
Quantitative Research
We conducted an online survey with about 10 users who fall in our target demographic.
78%
80% of the users complained that they monitoring irrelevant data in their field of work.
51%
50% of the users complained that they saw too many data.
42%
30% of the users are facing difficulty while working with old system and it waste their times.
36%
20% of the users complained that weakness of the system, put them under pressure and stress at work

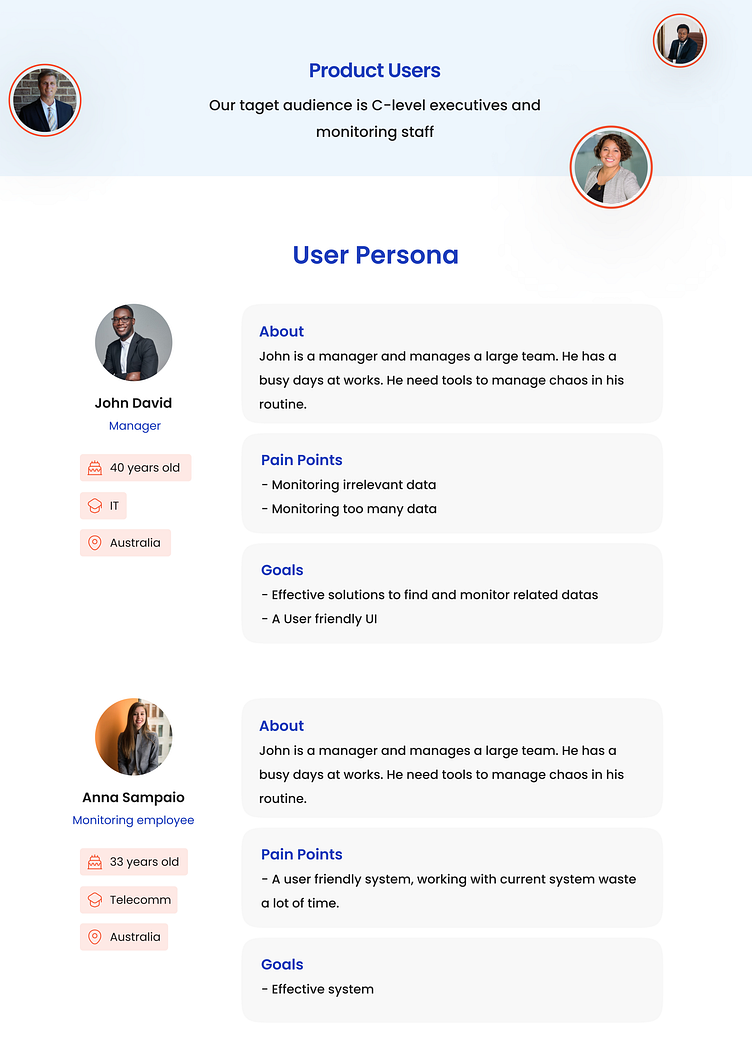
User Needs
There are too many irrevelant datas. Users need effective solutions to find and monitor related datas.
There are too many datas. Users need filter solutions.
Users need a user friendly system, working with current system waste a lot of time.
Users need a solution to be notified in critical situations.
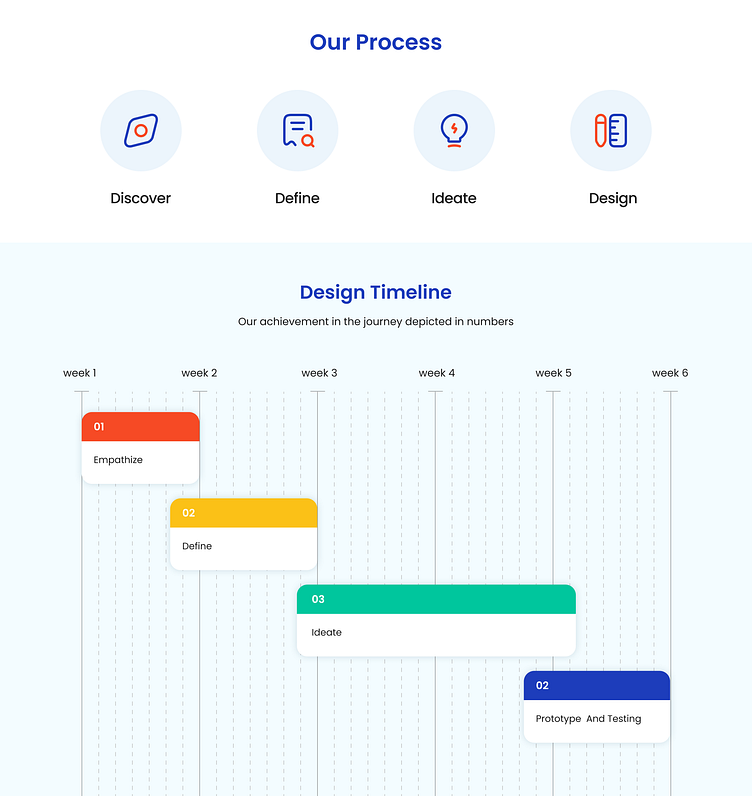
Wireframes
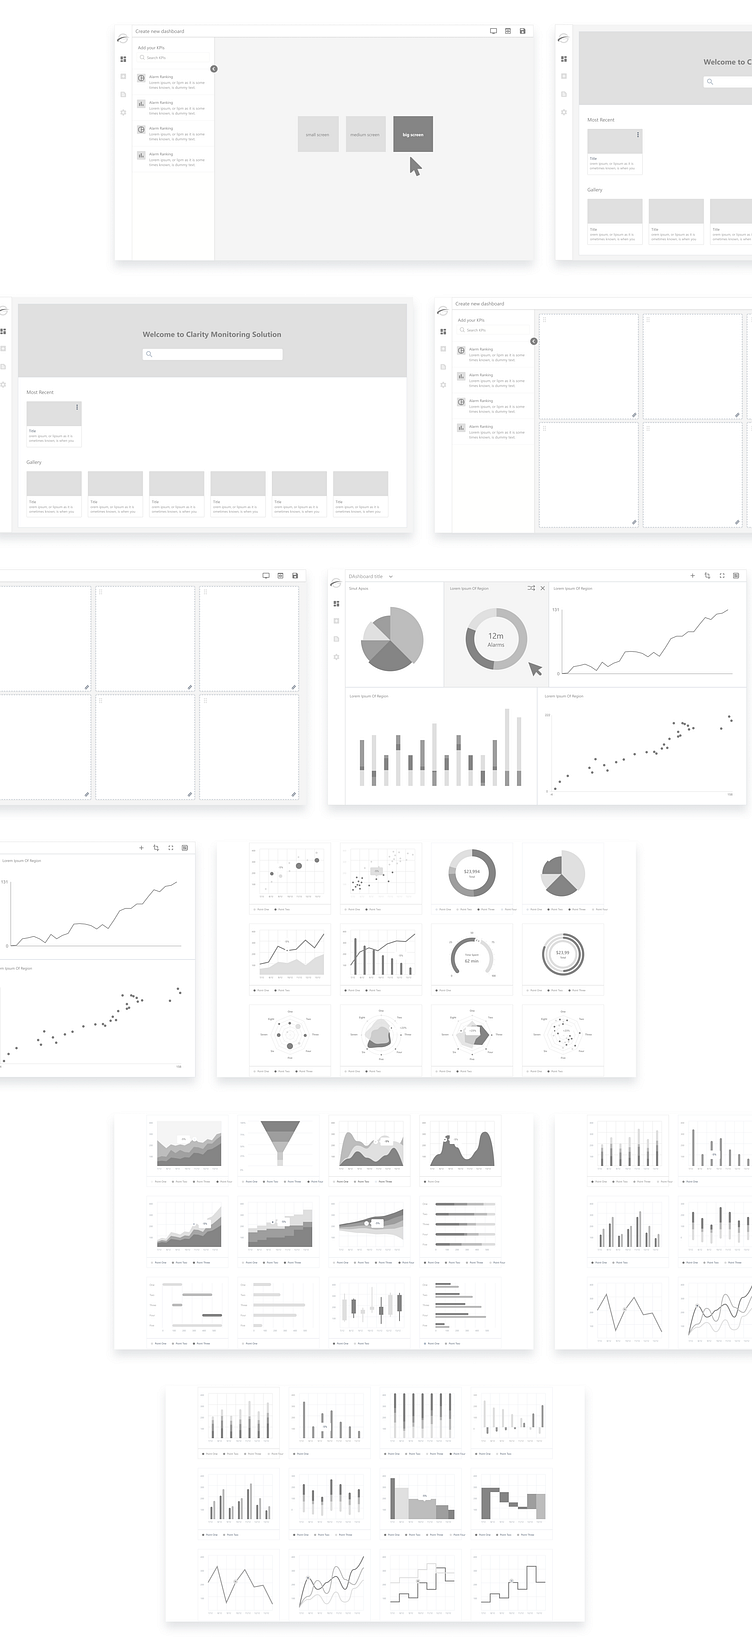
Design