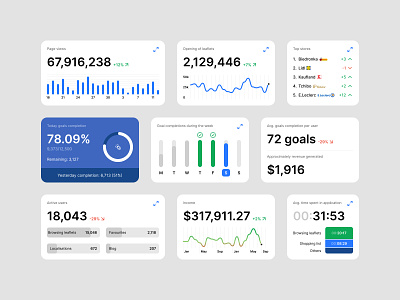
Design of Dark Mode User Interface for the Charts & Widgets
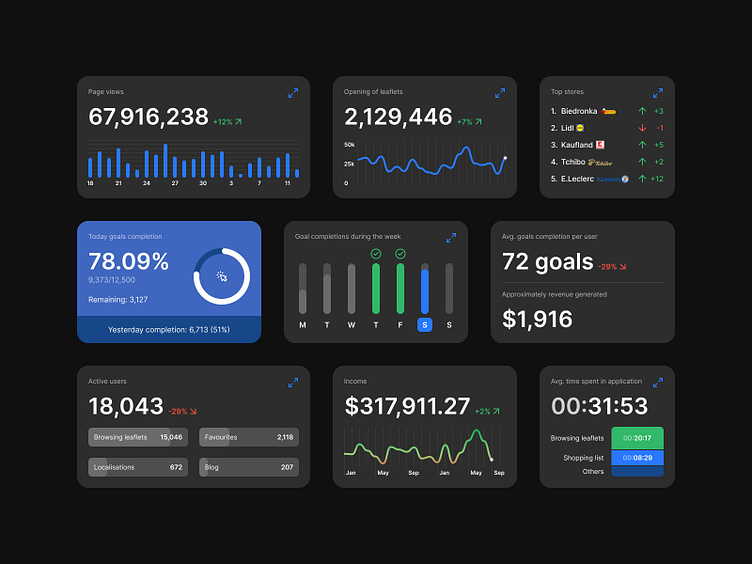
Charts and widgets concept for a dark mode user interface, showcasing a sleek and modern design that is both visually appealing and functional.
The chart widgets can be customized to fit a variety of data visualization needs, with easy-to-read labels and intuitive graphics that make it simple to understand complex data. The dark mode color scheme adds a touch of sophistication to the design, while also reducing eye strain and making it easier to use in low-light environments. Whether you're designing a data-heavy application or simply looking for inspiration on how to create a visually stunning user interface, this shot can help you create a chart widget that is both functional and stylish. Check out this shot for inspiration on how to design a chart widget that enhances the user experience and adds a touch of elegance to your application.