Data Visualization: Why Olympians aren't from the Midwest
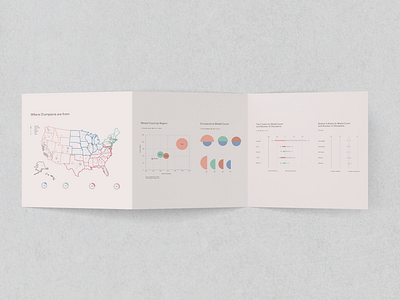
Data visualization of United States Olympic athletes’ participation by region. Data ranges in time and density to communicate the narrative that states with more resources and a dense population are more likely to medal. The design focused on time, space, accessibility, readability and storytelling.
