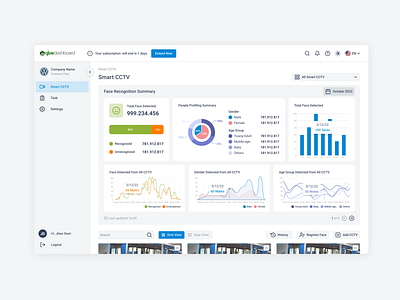
Data Analytics UI Design
Get a quick and interactive visual summary of your data with these sleek analytics displays! Made up of total figures, categories, and analytics based on time, these displays were developed to meet the client's needs for a fast and engaging overview of their data. From bar graphs to pie charts, we've included a variety of analytics to keep users engaged and informed.
If you're interested in working on a project or hiring me for a job, just let me know. I'm always open to new opportunities. If you'd like to connect on LinkedIn , I'd love to chat there too. Cheers!
More by Indah Chairunnisa View profile
Like
