DailyUI 018 - Analytics Chart
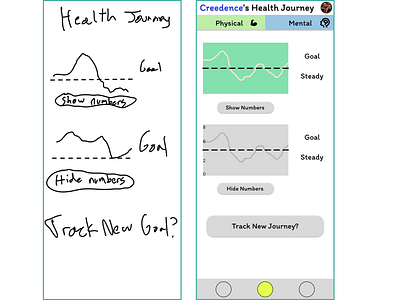
This is a brief visual concept of how an analytics chart could be utilized in an app about an individual's health journey. There are some users(including many friends of mine who experience anxiety) who want to track their journey without seeing the numbers, particularly weight-loss journeys, and psychological research has shown having a general sense of your journey without the specific numbers can be very useful for these individuals. Showing vs Hiding the numbers is essentially a mental health accessibility feature for these users.
I first sketched out a general thought, and then created a basic wireframe version of the concept. I then turned each of the individual pieces into components as practice so that if I choose to continue iterating or sketching a concept for additional pages I can maintain each of those components for consistency.
